
Exploring Geometries for Editing (2016–2018)
The design space for gesture-based data editing is potentially enormous. Geometries and constrained data types provide conceptual scaffolding to structure that space. To build and populate it, we must first understand the characteristics of constrained data types, how geometric combinations manifest those characteristics (or not), and whether those combinations are likely to be useful and usable for actual visualization applications.
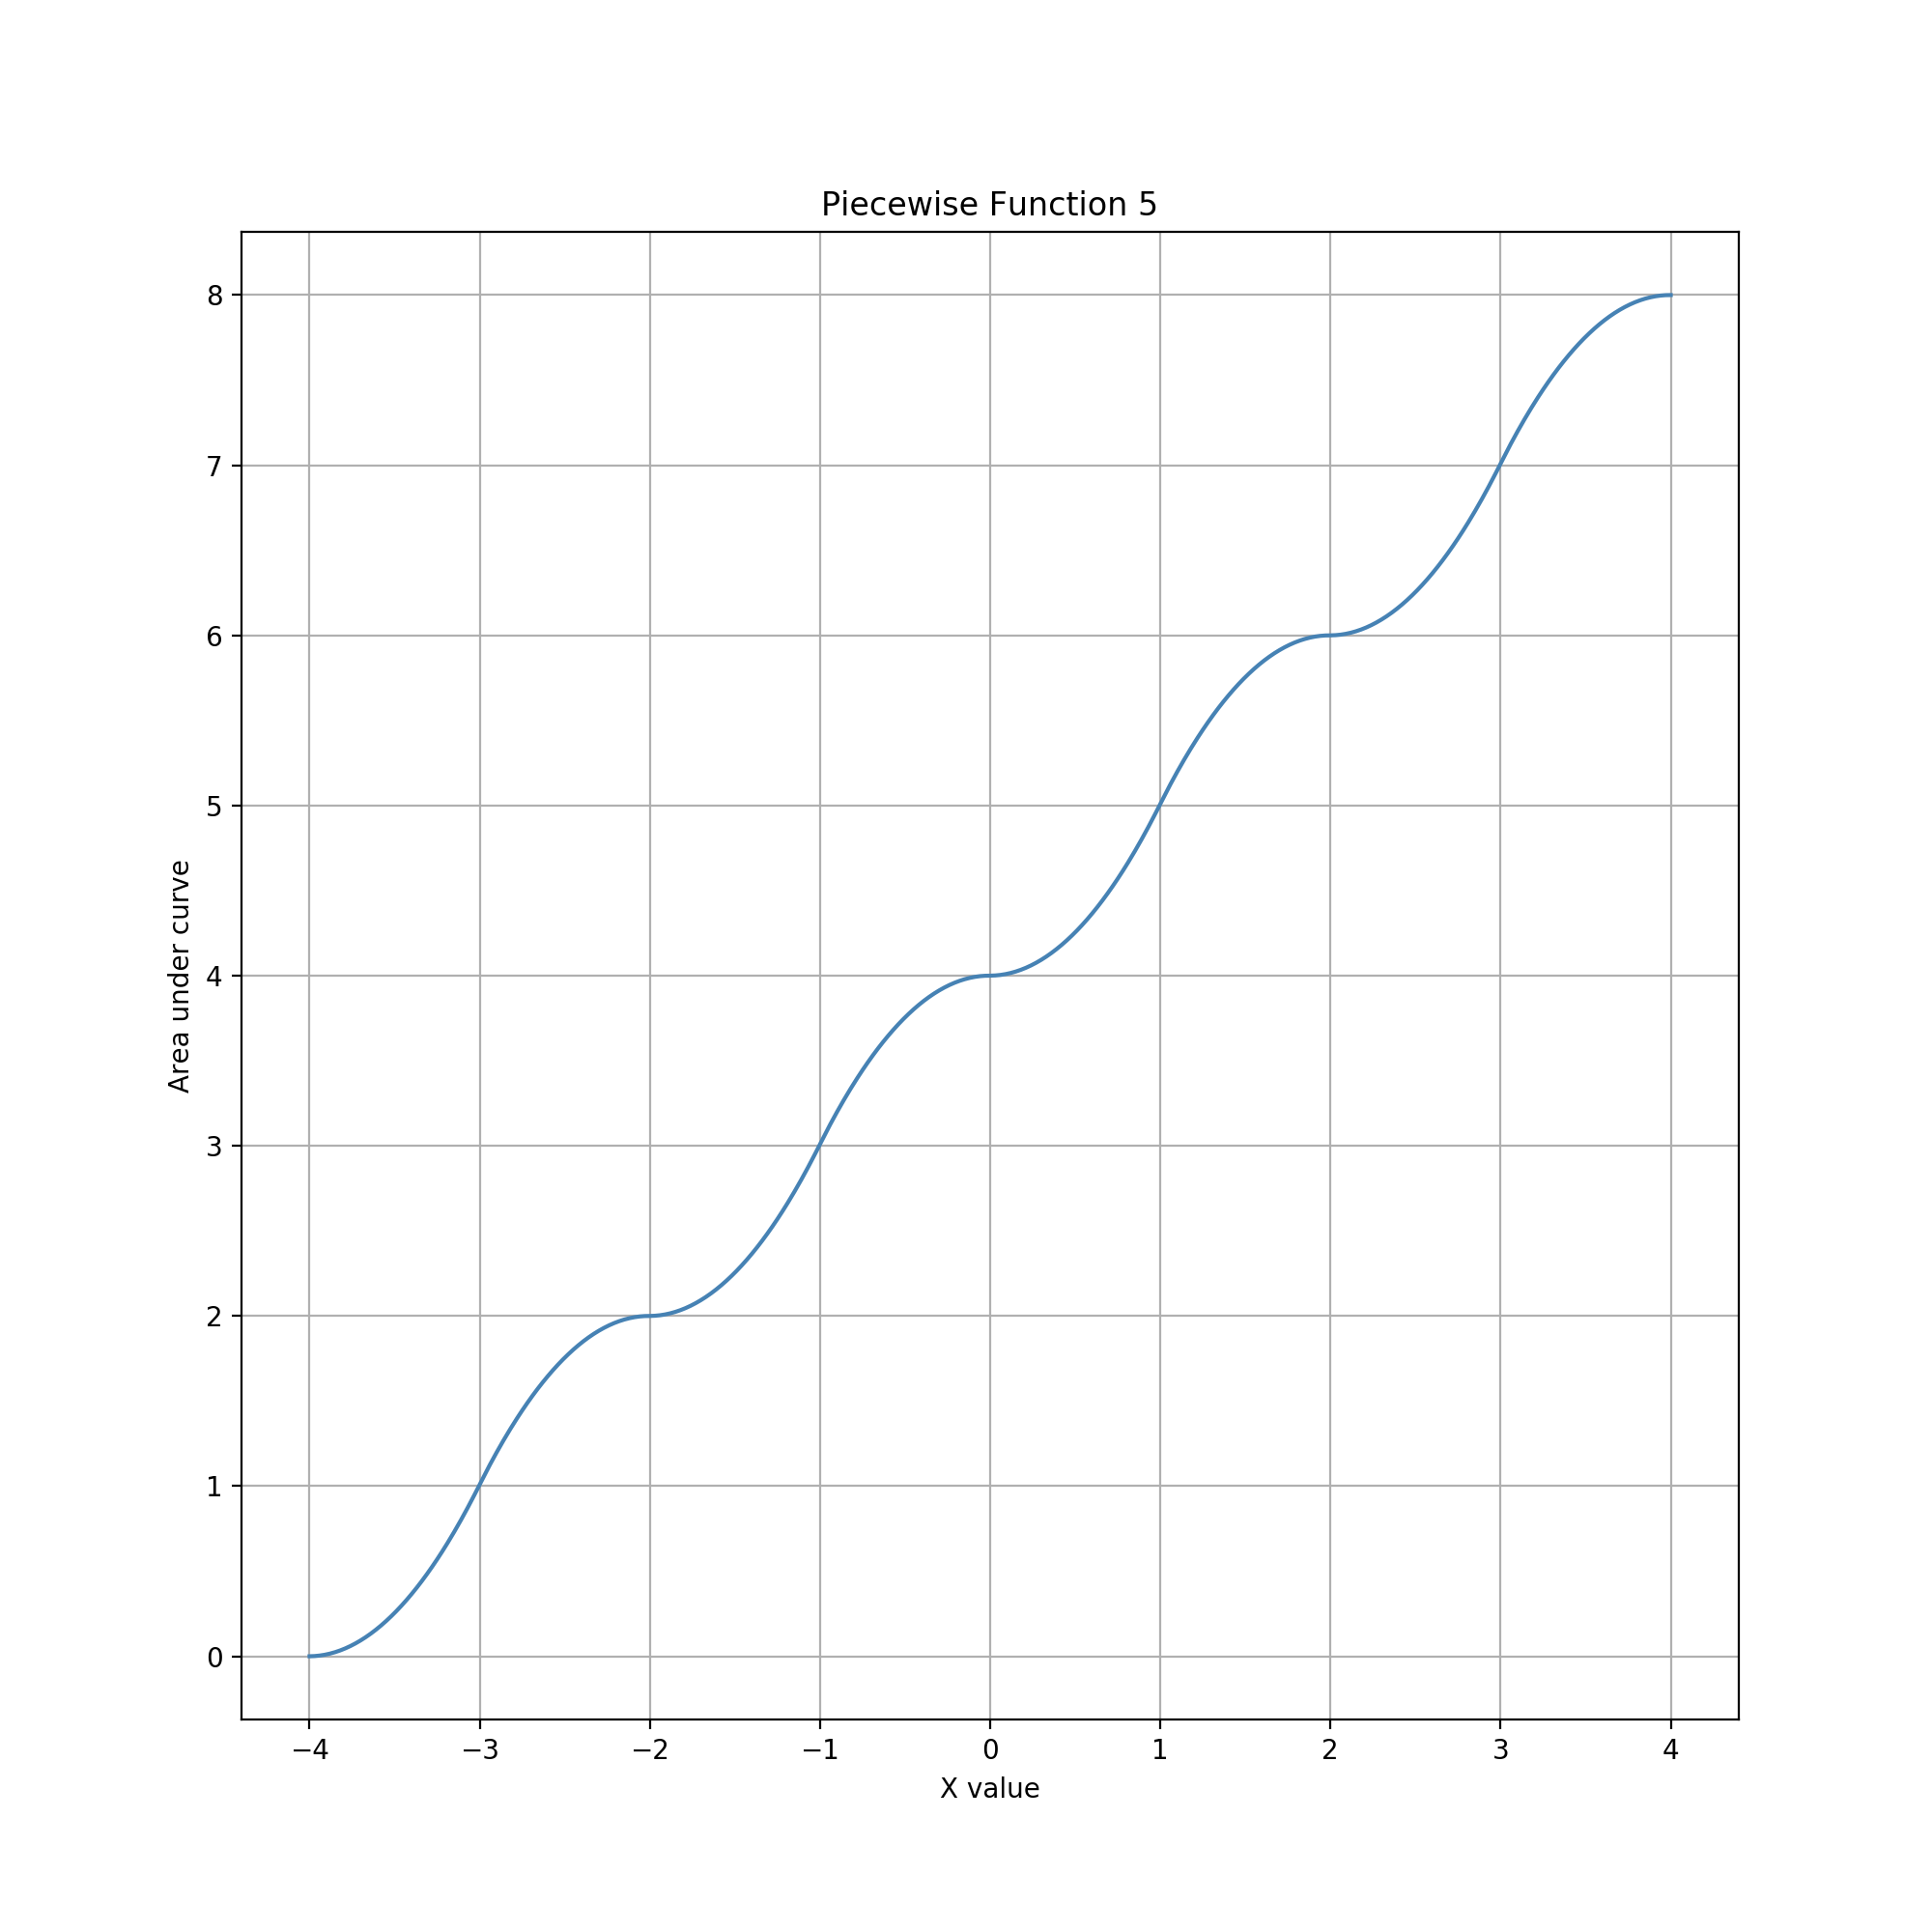
The following sequence of 13 examples explores ways of combining glyph and guide geometries to edit small bounded decimal values. Glyph geometry progresses from the simple and familiar to the complex and exotic. Guide geometry is always a vertical line that can be dragged left and right. The edited data value is always an area defined by the two geometries. In other words, we treat glyph geometry as the exploratory variable with guide geometry and data value mapping as controls. This controlled approach helps us probe the reachability of data values and the sensitivity/precision of interactive movements as a function of particular geometry pairings.
Glyph = Circle, Guide = Vertical Line
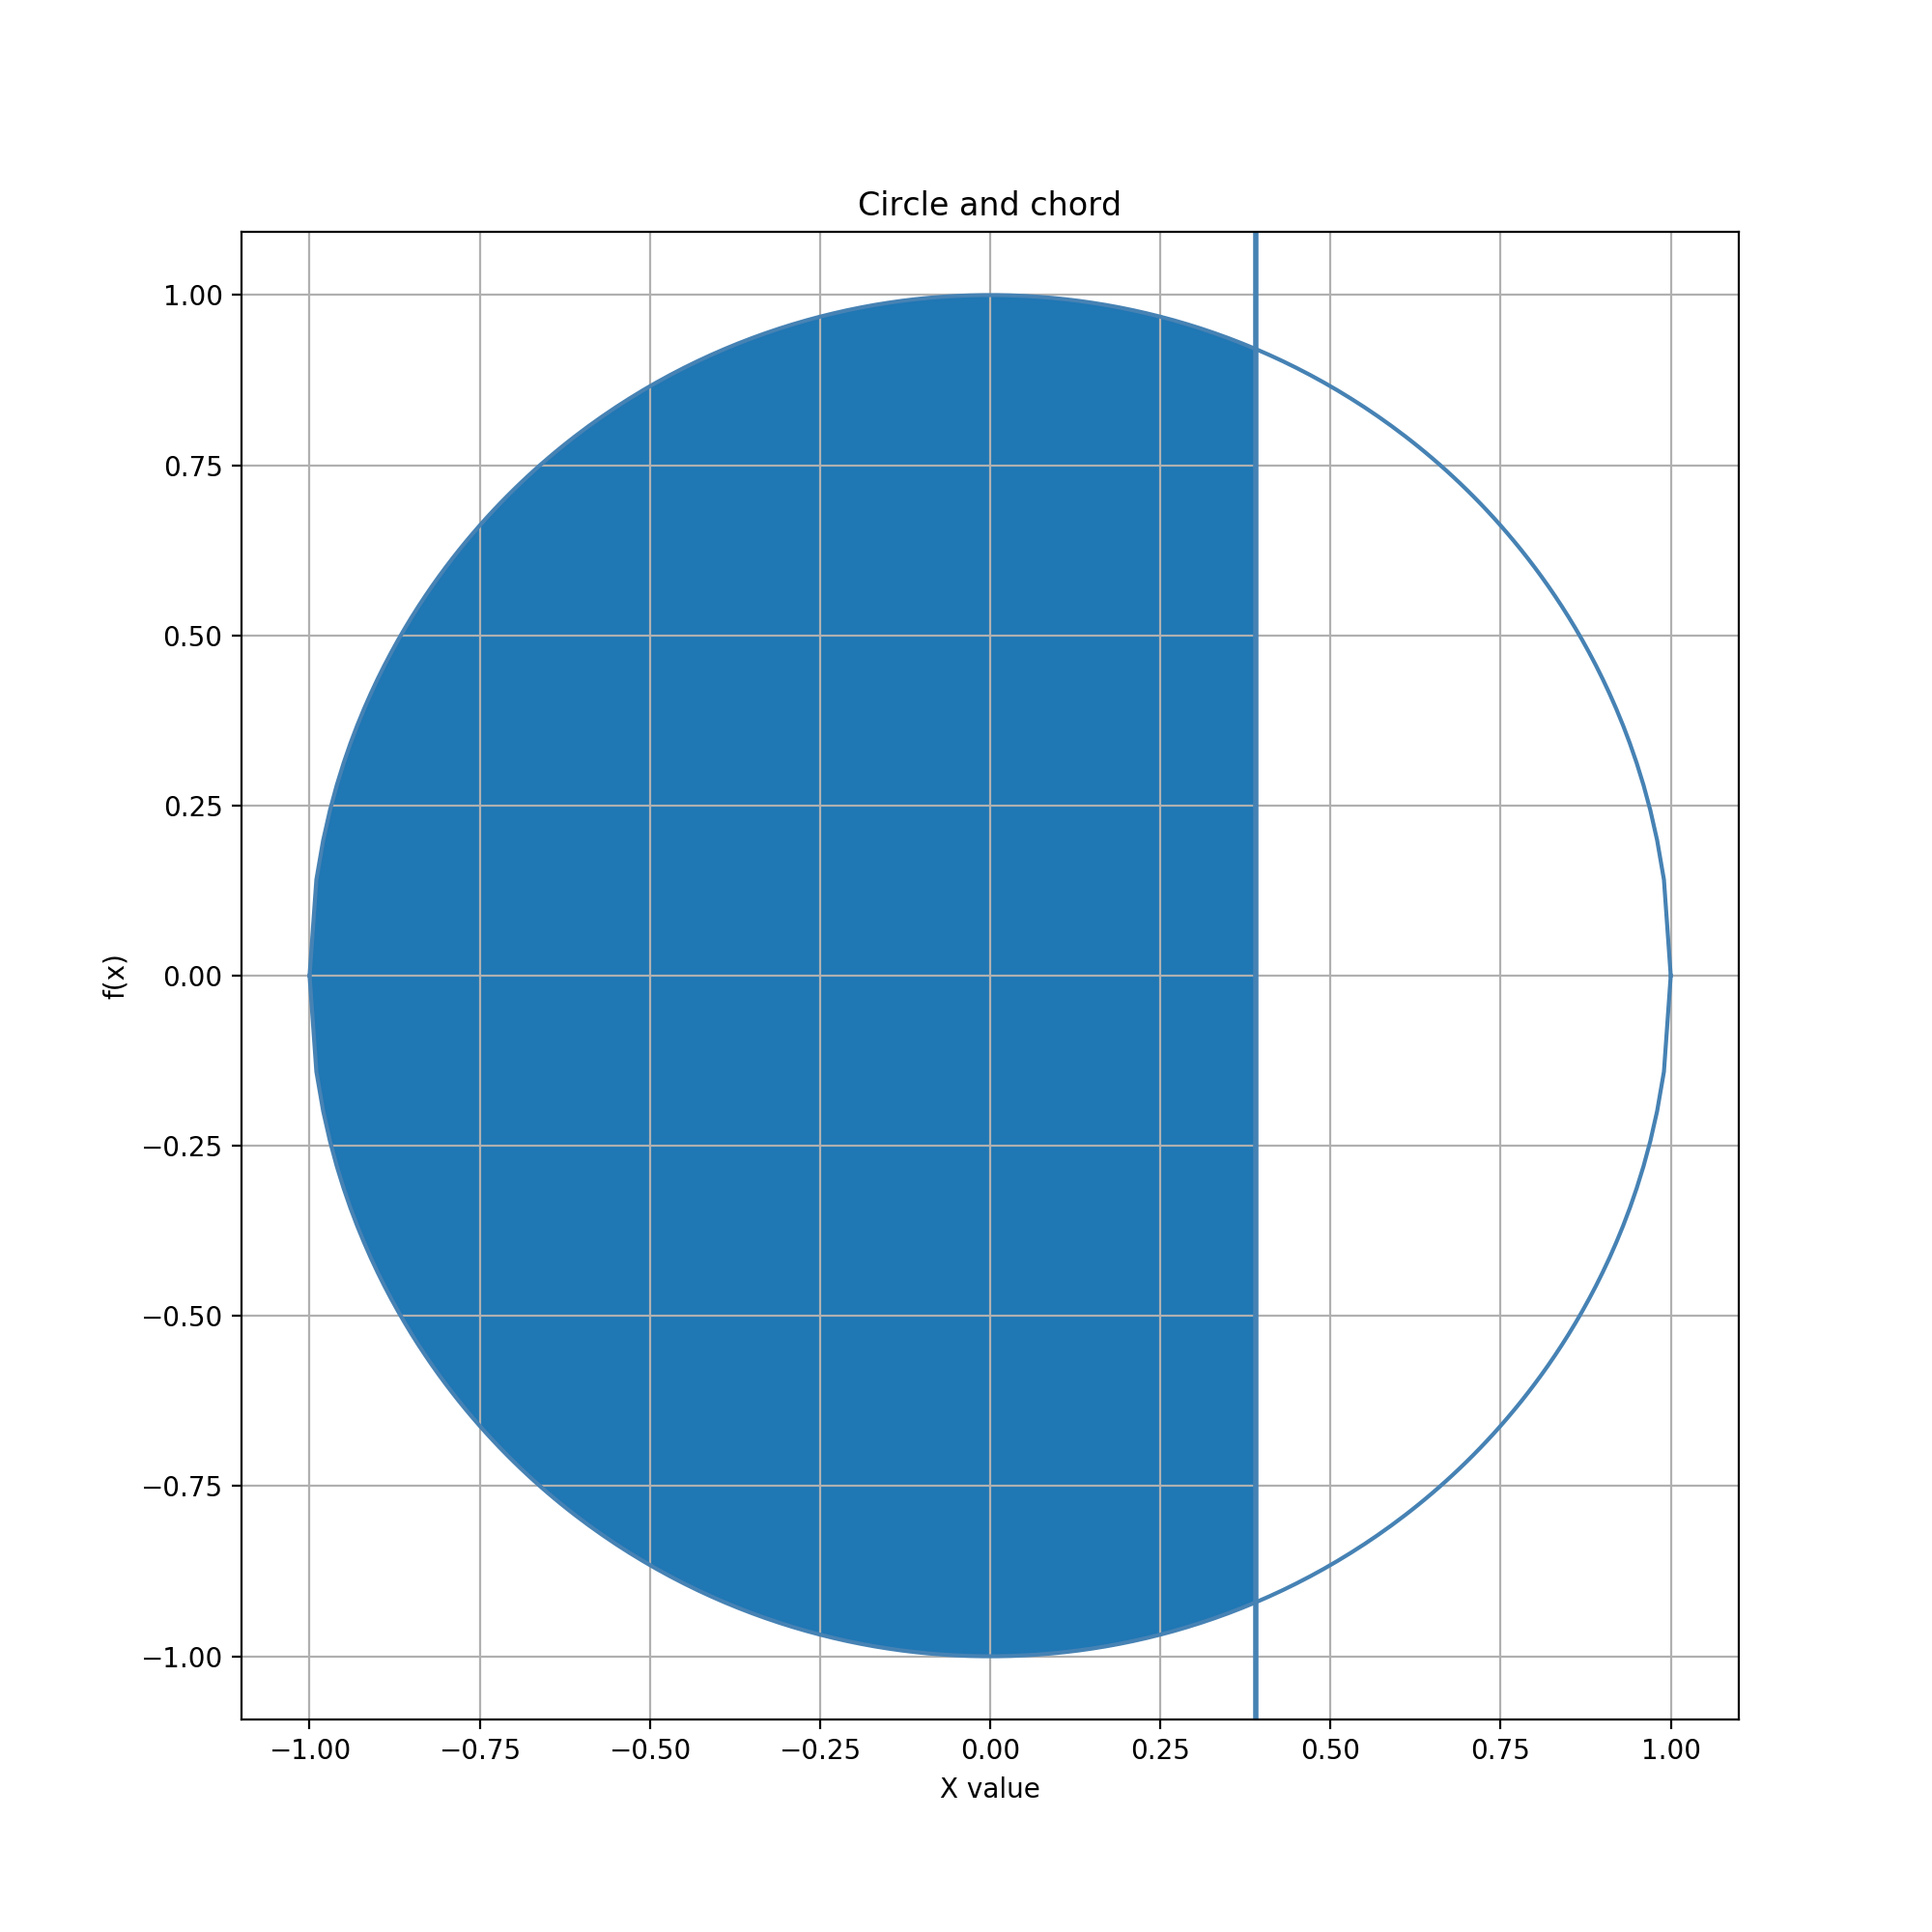
In this example, the glyph is a circle. The guide is a vertical line which can be moved horizontally. When the line intersects the circle at more that one point, the resulting chord defines two regions inside the circle. The edited data value is the area of the region to the left of the chord.
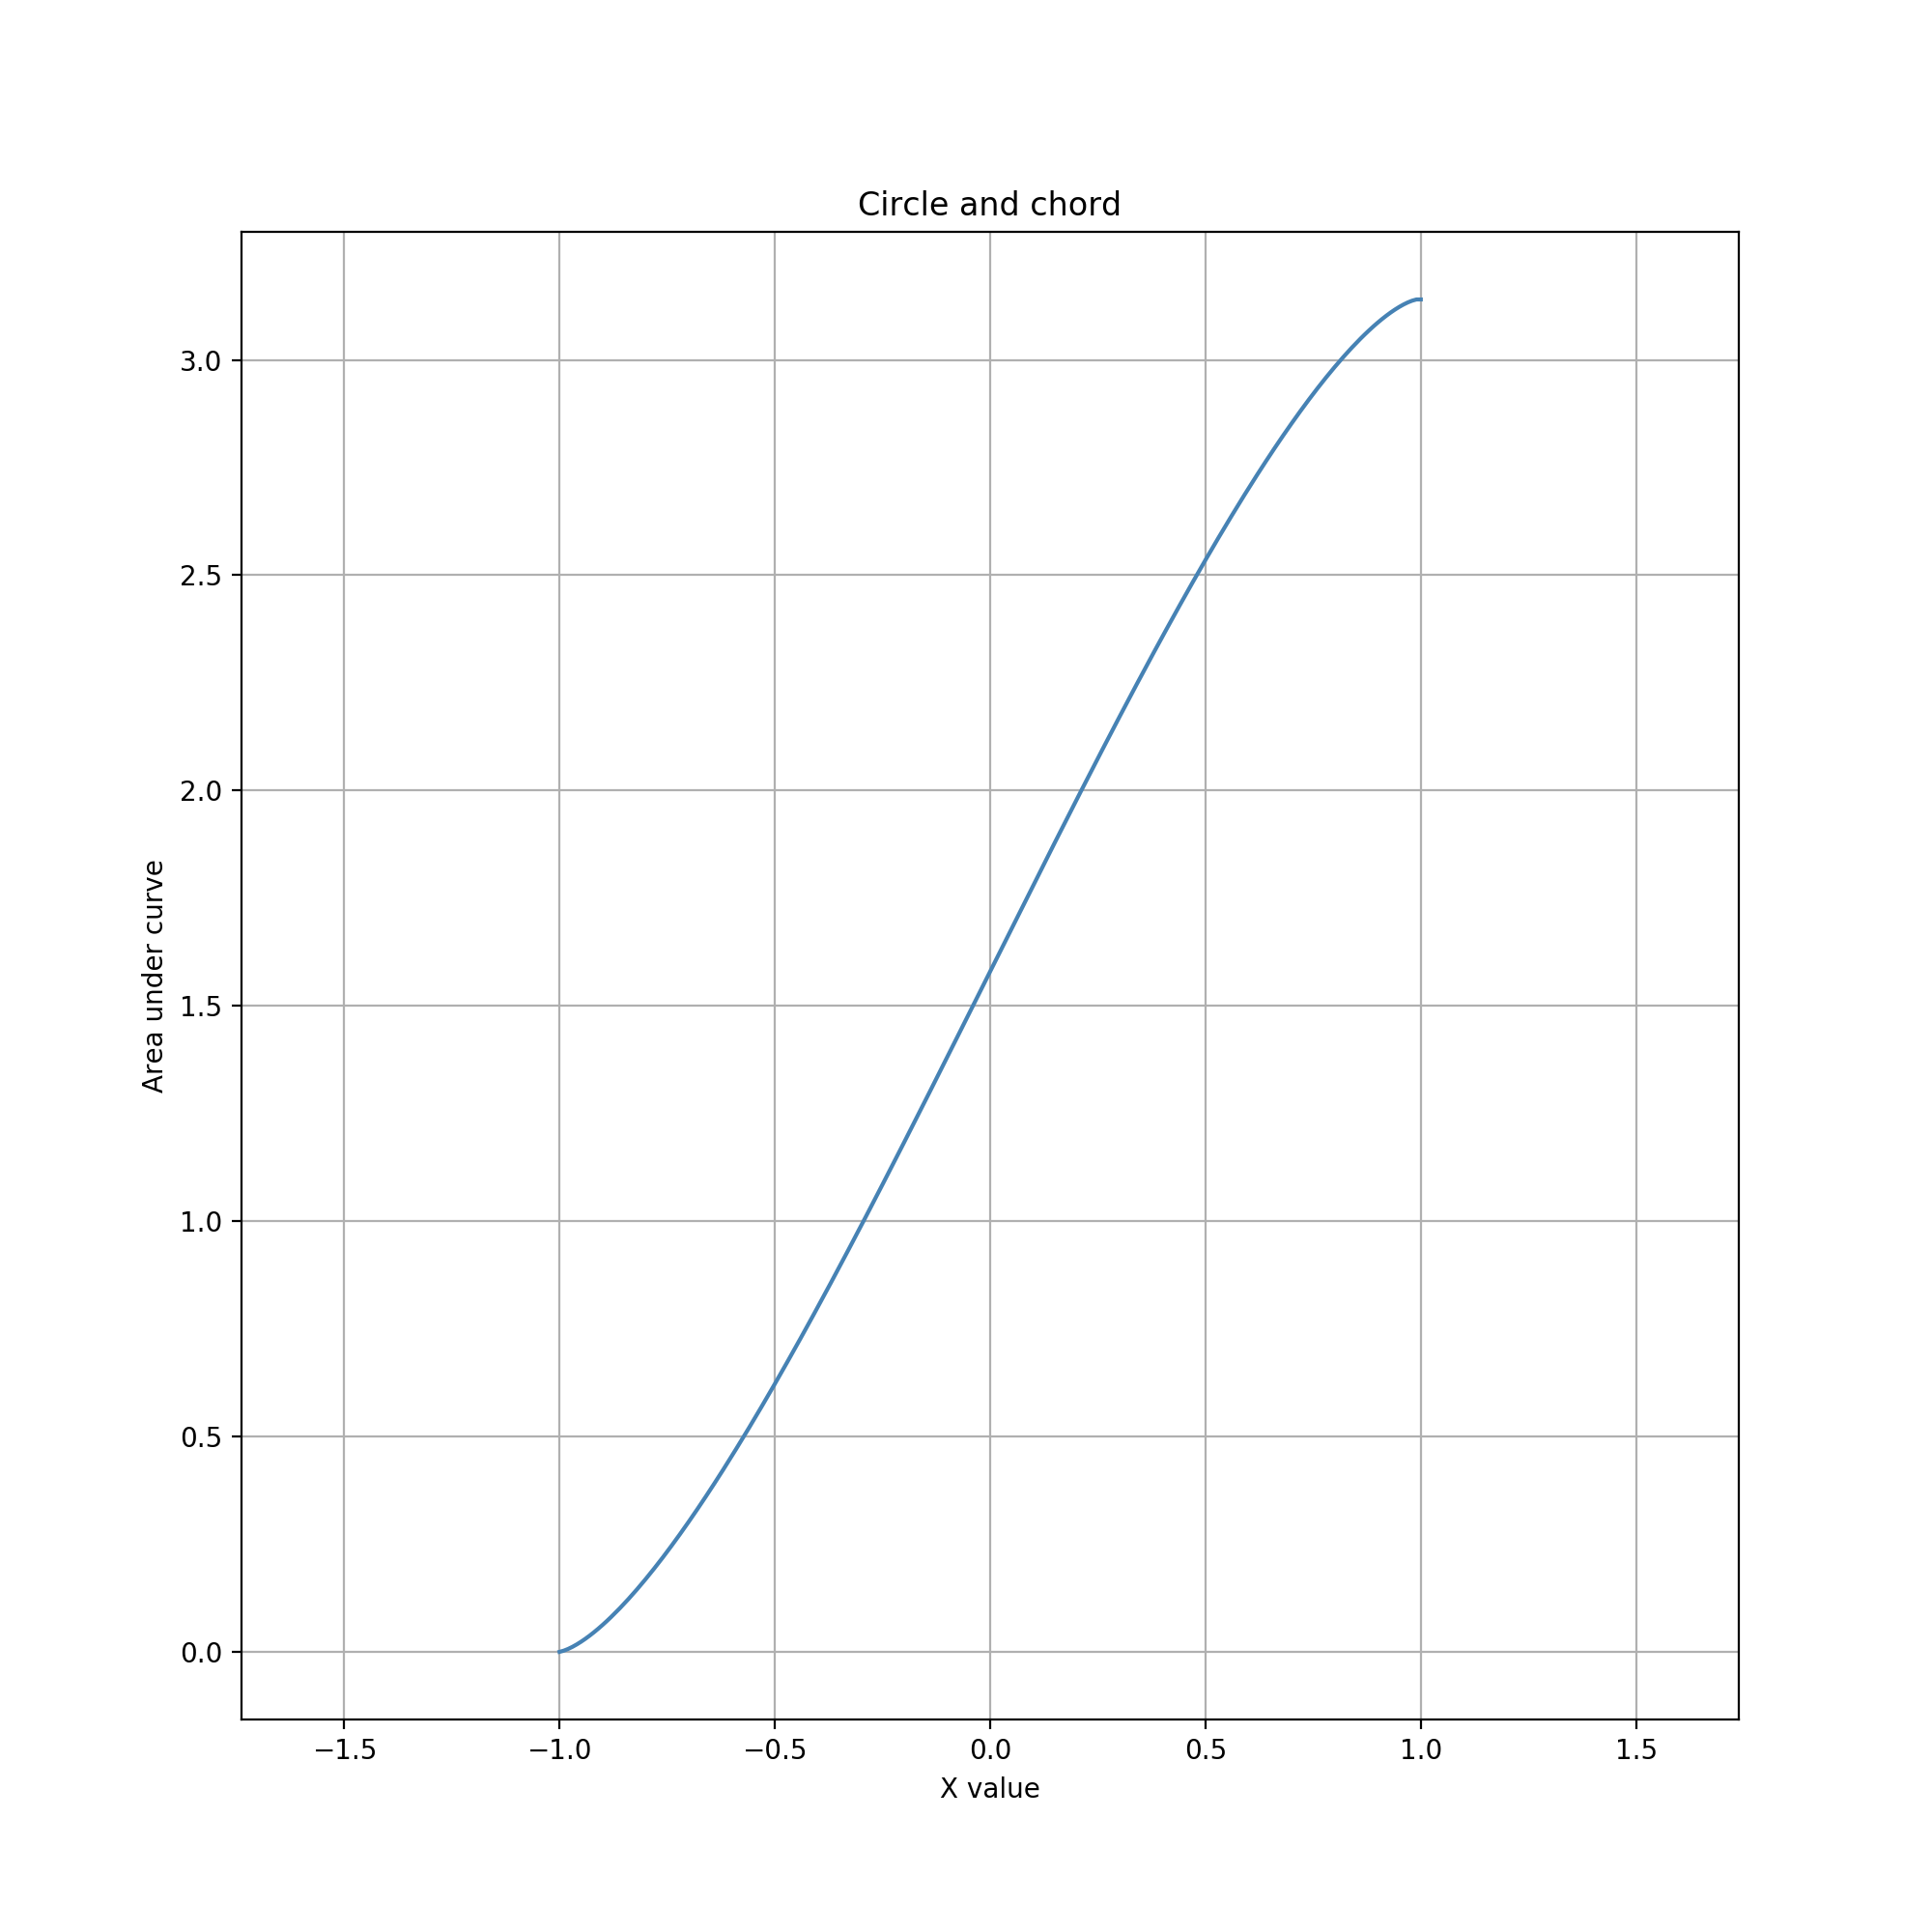
Reachable data values range from 0 to the area of the whole circle. (Alternatively, the area could be normalized for a maximum of 1.) Like the circle-circle example above, a 0 data value is easily and quickly reached by moving the line anywhere to the left or right of the circle. Unlike the circle-circle example, the data value can be more precisely adjusted near the maximum (when the line is just left of the circle's rightmost point), as well as near zero (just right of the leftmost point). Near the center of the circle, moving the line changes the data value more rapidly but also more linearly.
For this combination of geometries, area serves as a constrained data type with several characteristics: (1) is has a lower bound of 0; (2) it has an upper bound equal to total circle area; (3) inside these bounds the reachable values are distributed quadratically, with highest density at the extrema; (4) outside each bound, the reachable value is a constant equal to the bound; and (5) the distribution is symmetric about the midpoint value.
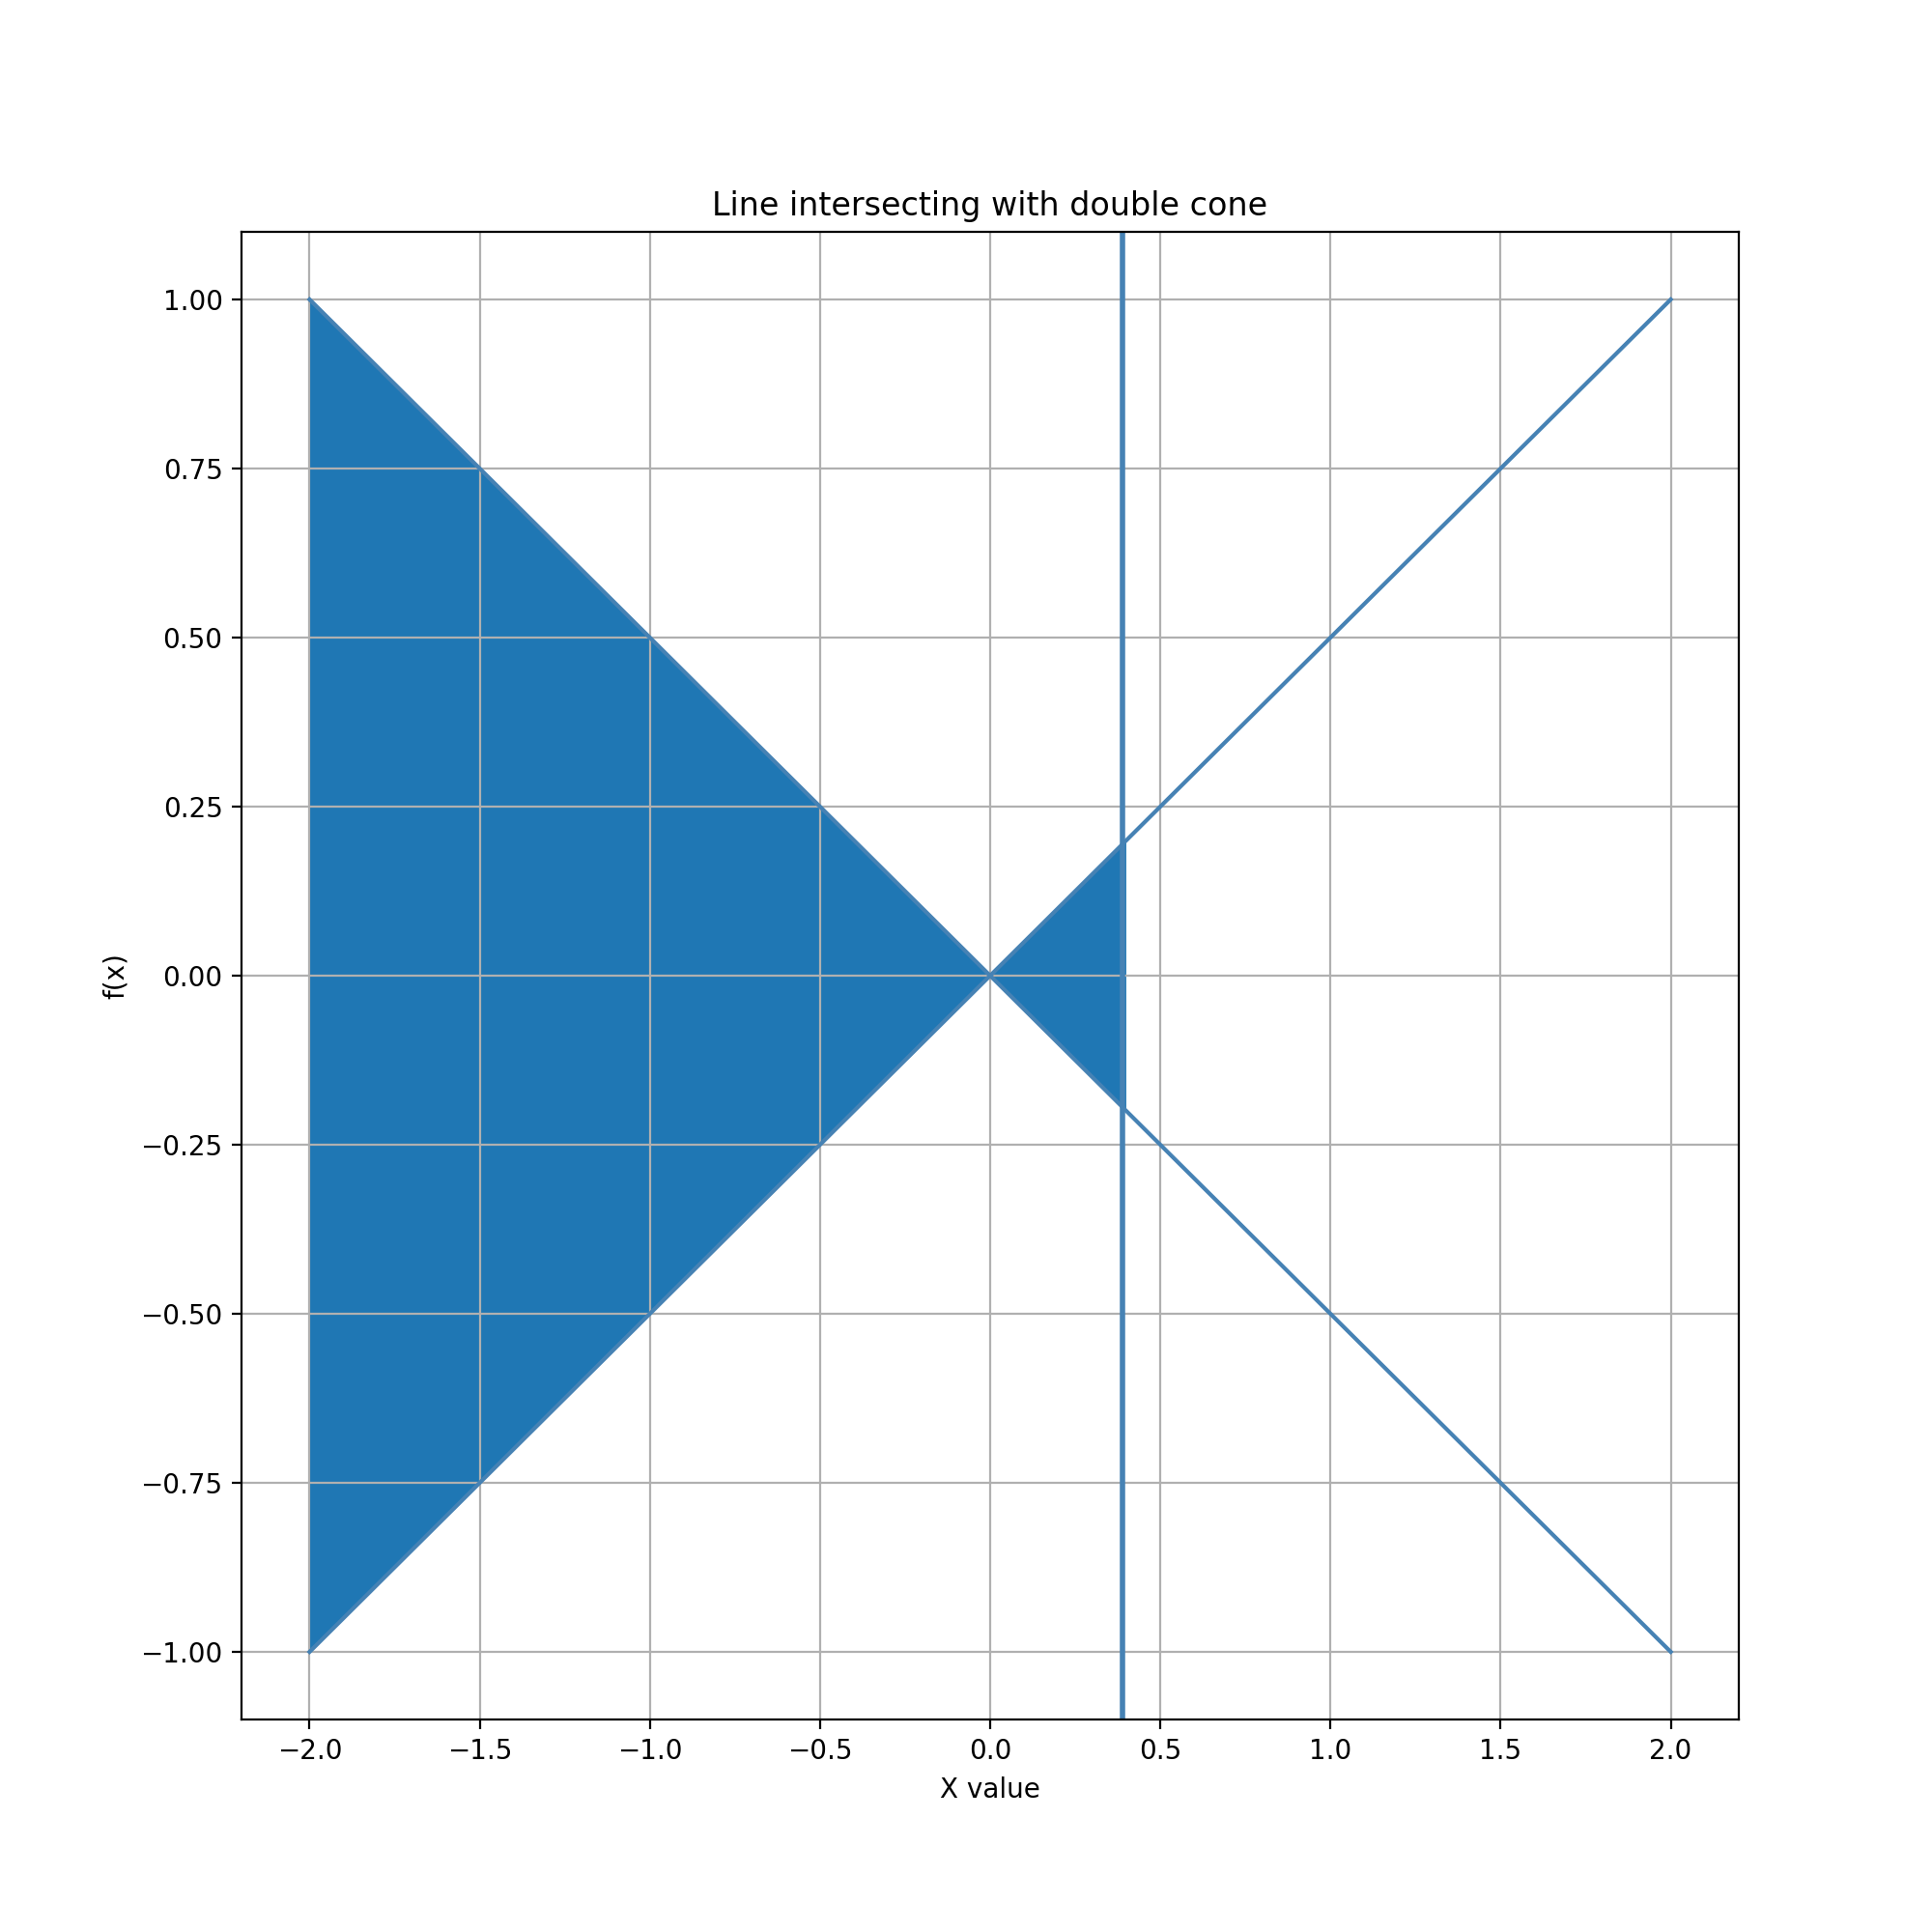
Glyph = Cone, Guide = Vertical Line
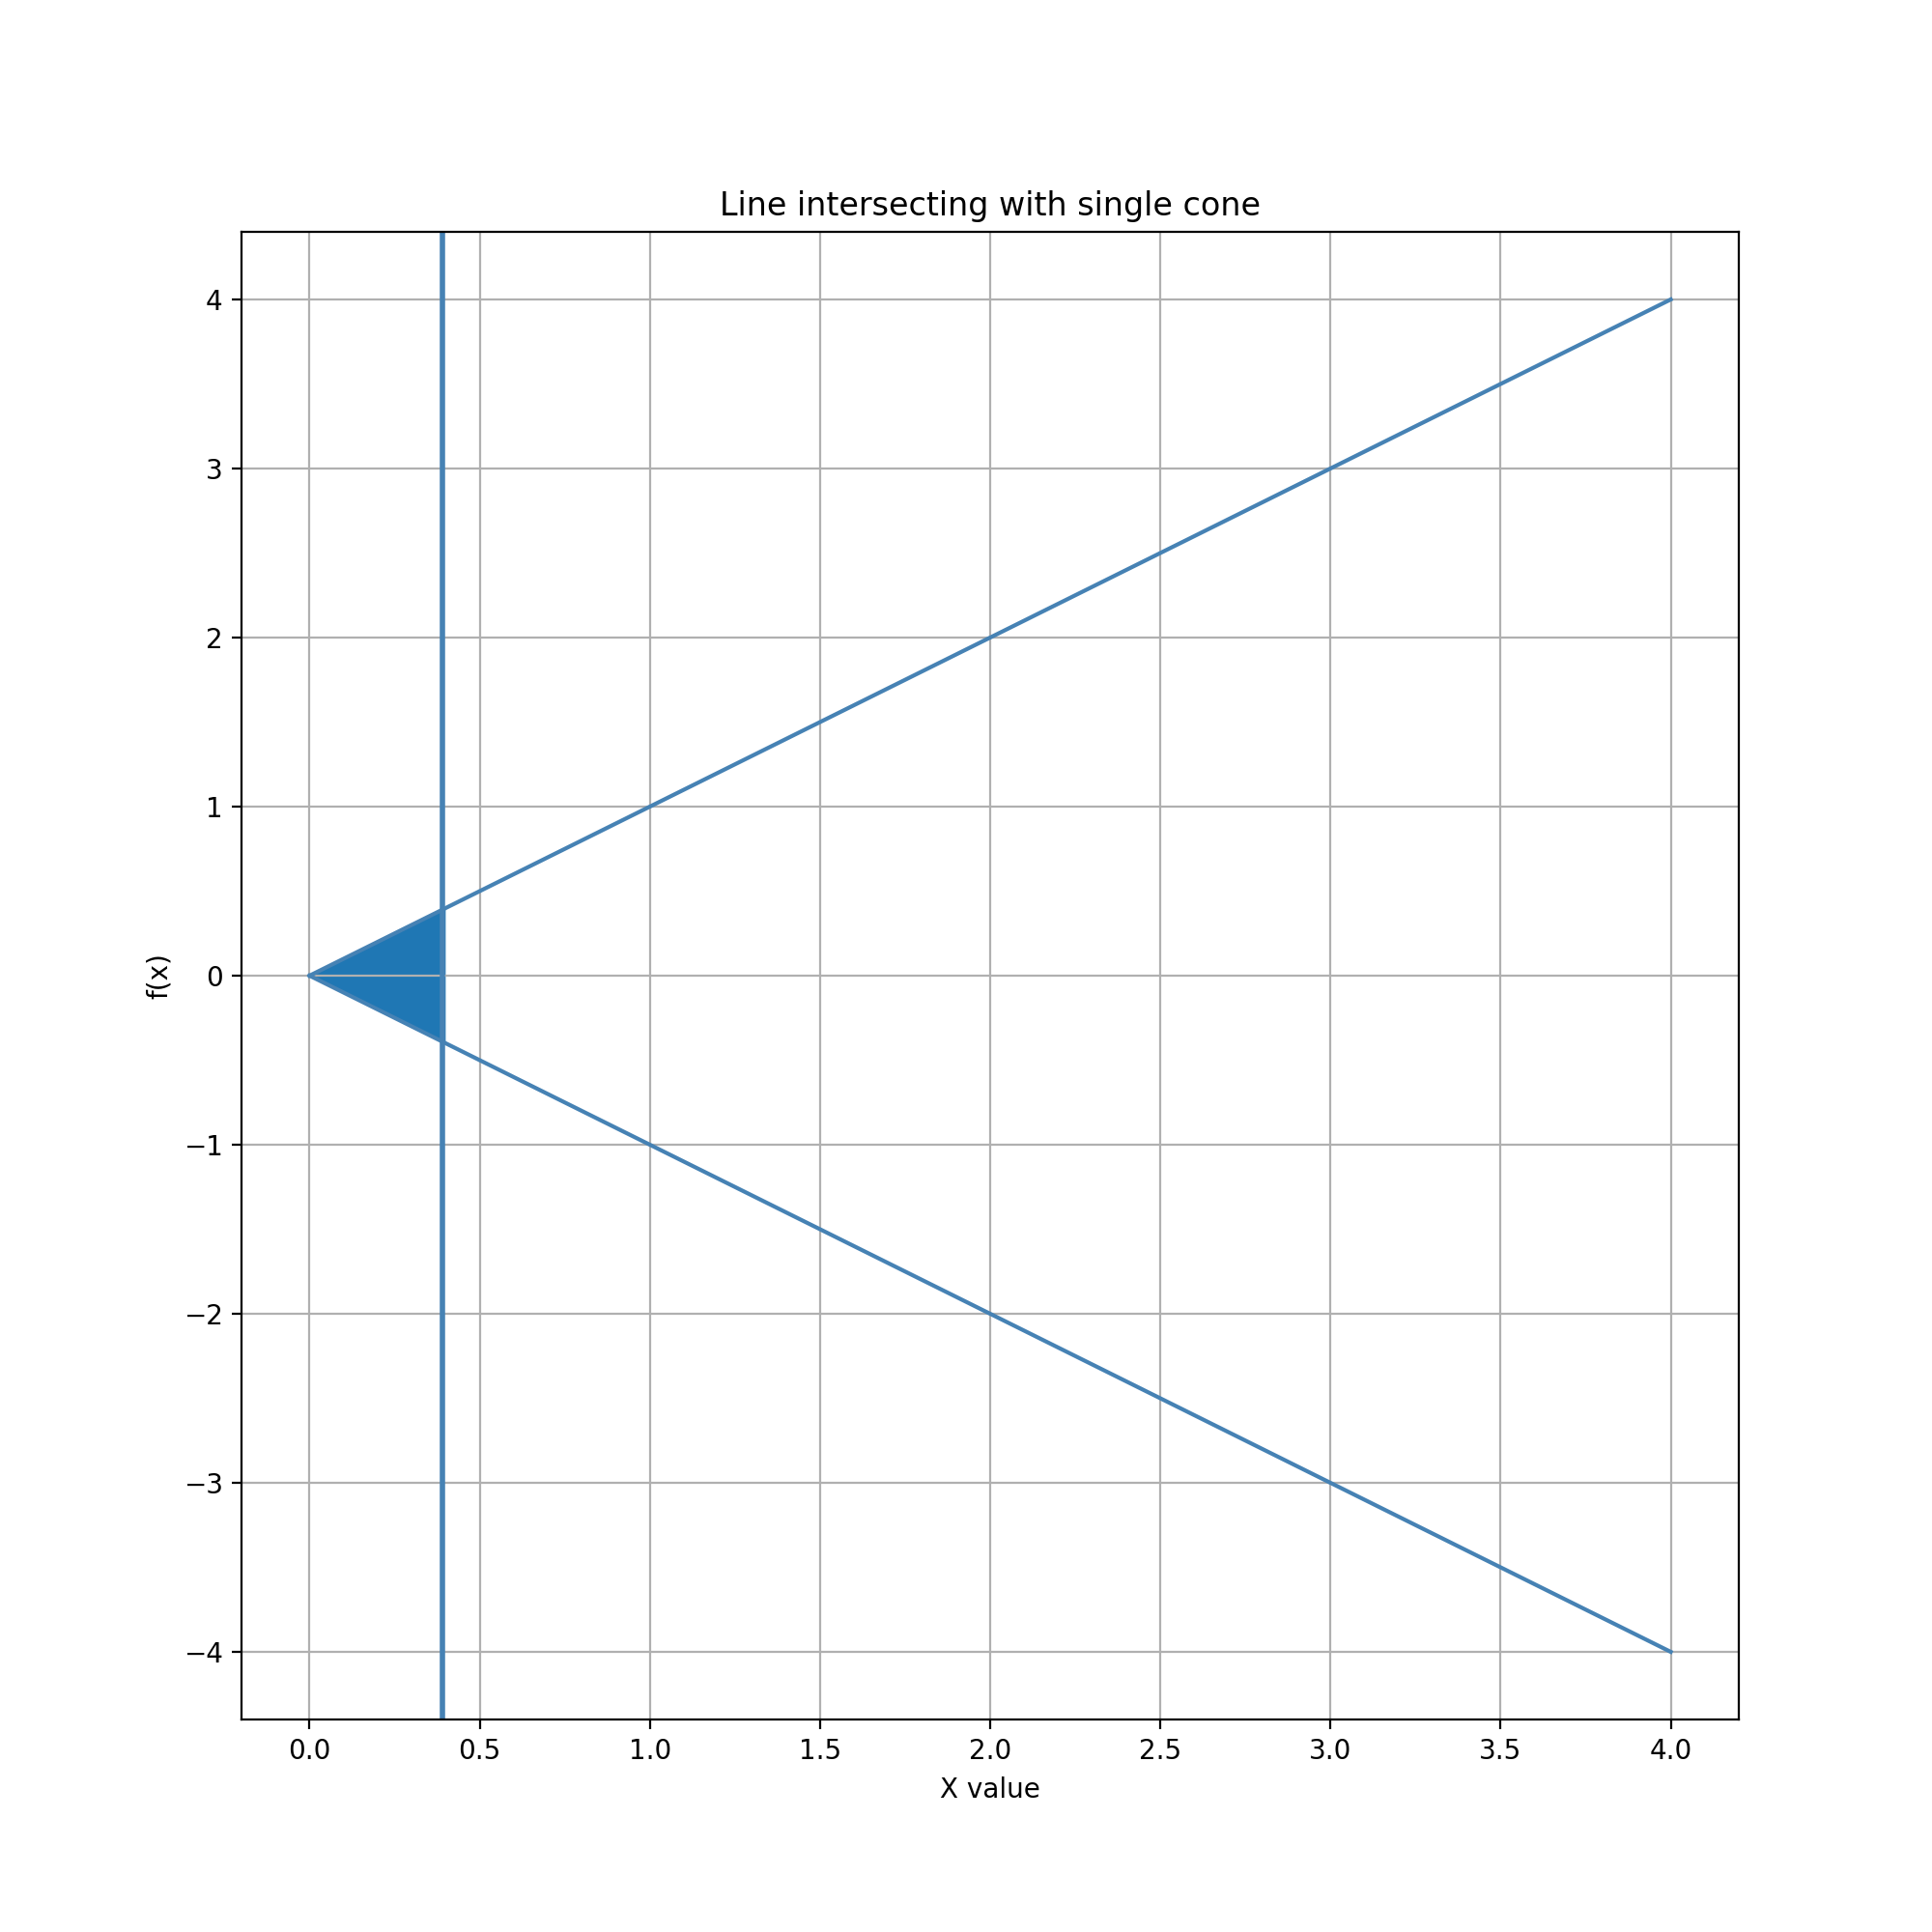
In this example, the glyph is a horizontal cone. The guide is a vertical line which can be moved horizontally. The line cuts the cone vertically, enclosing a region left of the line and right of the cone's apex. The edited data value is the area of this region.
Many visualizations imply infinite geometry through the grid and axis decoration of view coordinate systems, but rarely (if ever) use it explicitly in data representation or interaction. This example introduces the interesting prospect of using infinite geometries for visual encoding and editing of data. For instance, an infinite cone could be used to visually encode the potential extent of a propagating wavefront.
Reachable data values have a lower bound of 0 and no upper bound. Because the cone extends infinitely to the right, in theory the line can be dragged far to the right to enclose an arbitrarily large region. In practice dragging is limited by the finite space and time available for interacting with the guide inside a view. The lower bound of 0 can be reached by moving the line anywhere to the left of the cone. However, this might not be quick or easy if the line has been previously dragged far to the right. (This observation suggests that there would be value in studying the dynamics of autoscrolling for geometries beyond rectangles.)
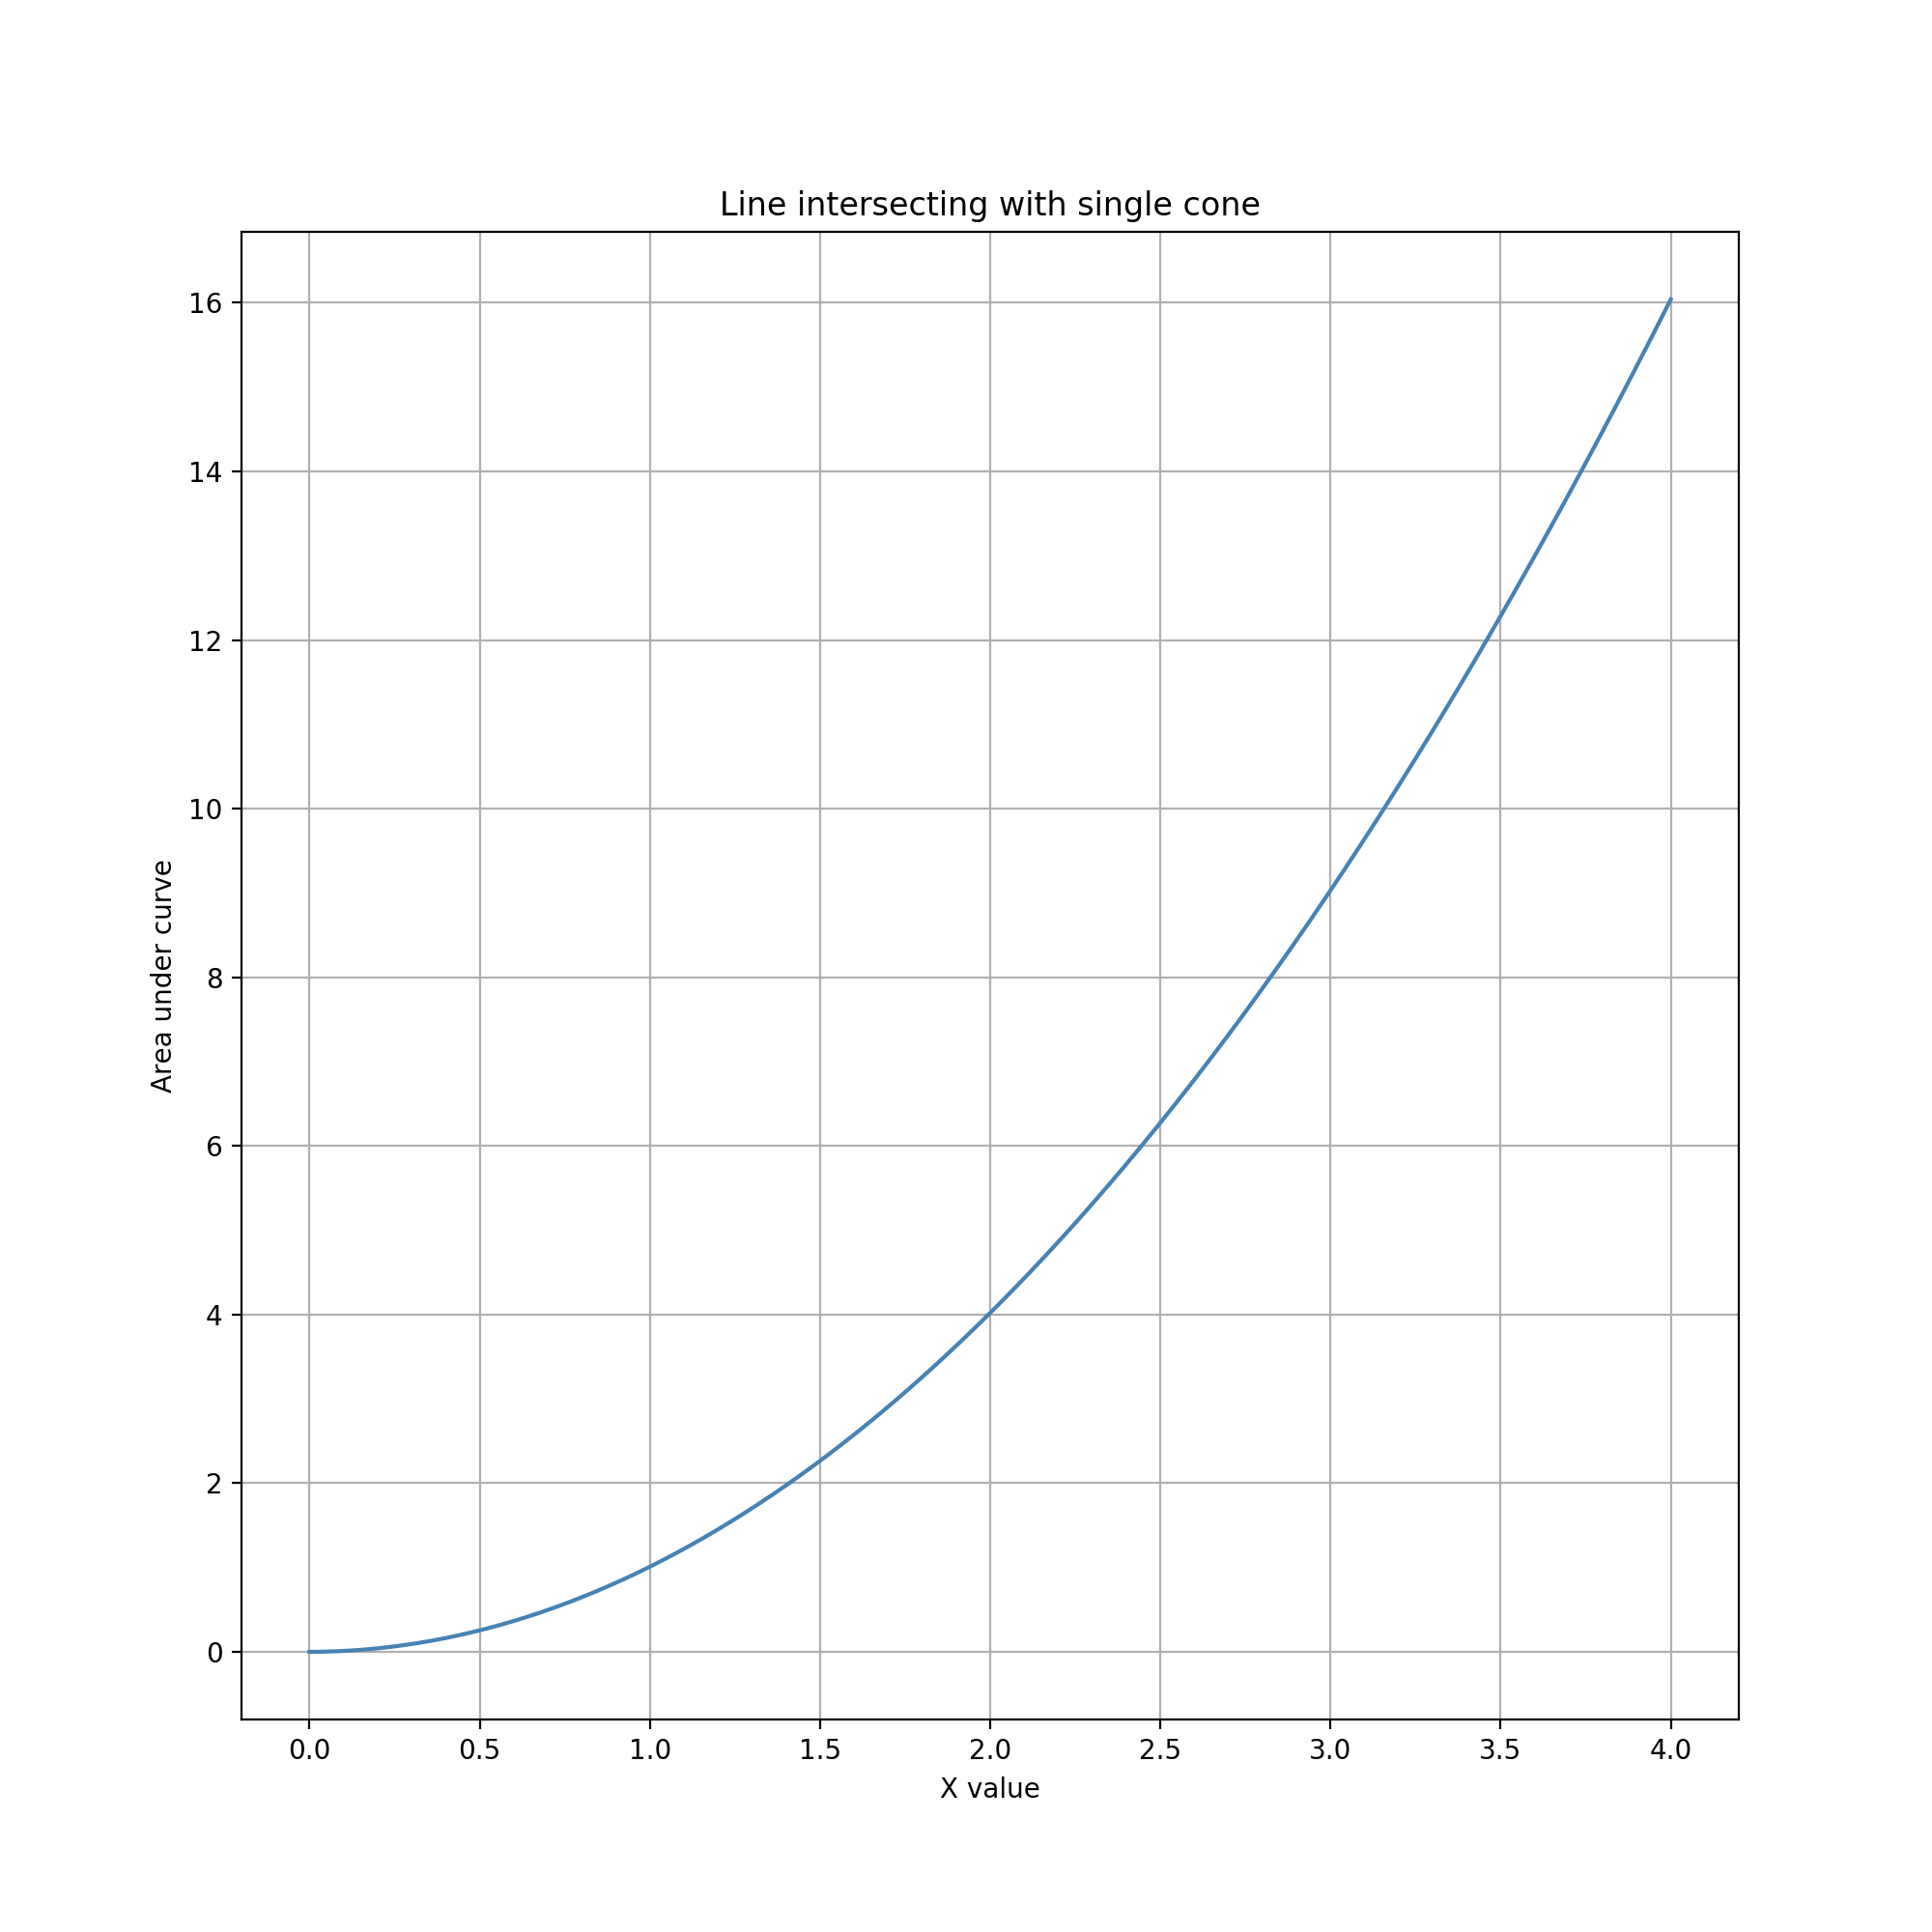
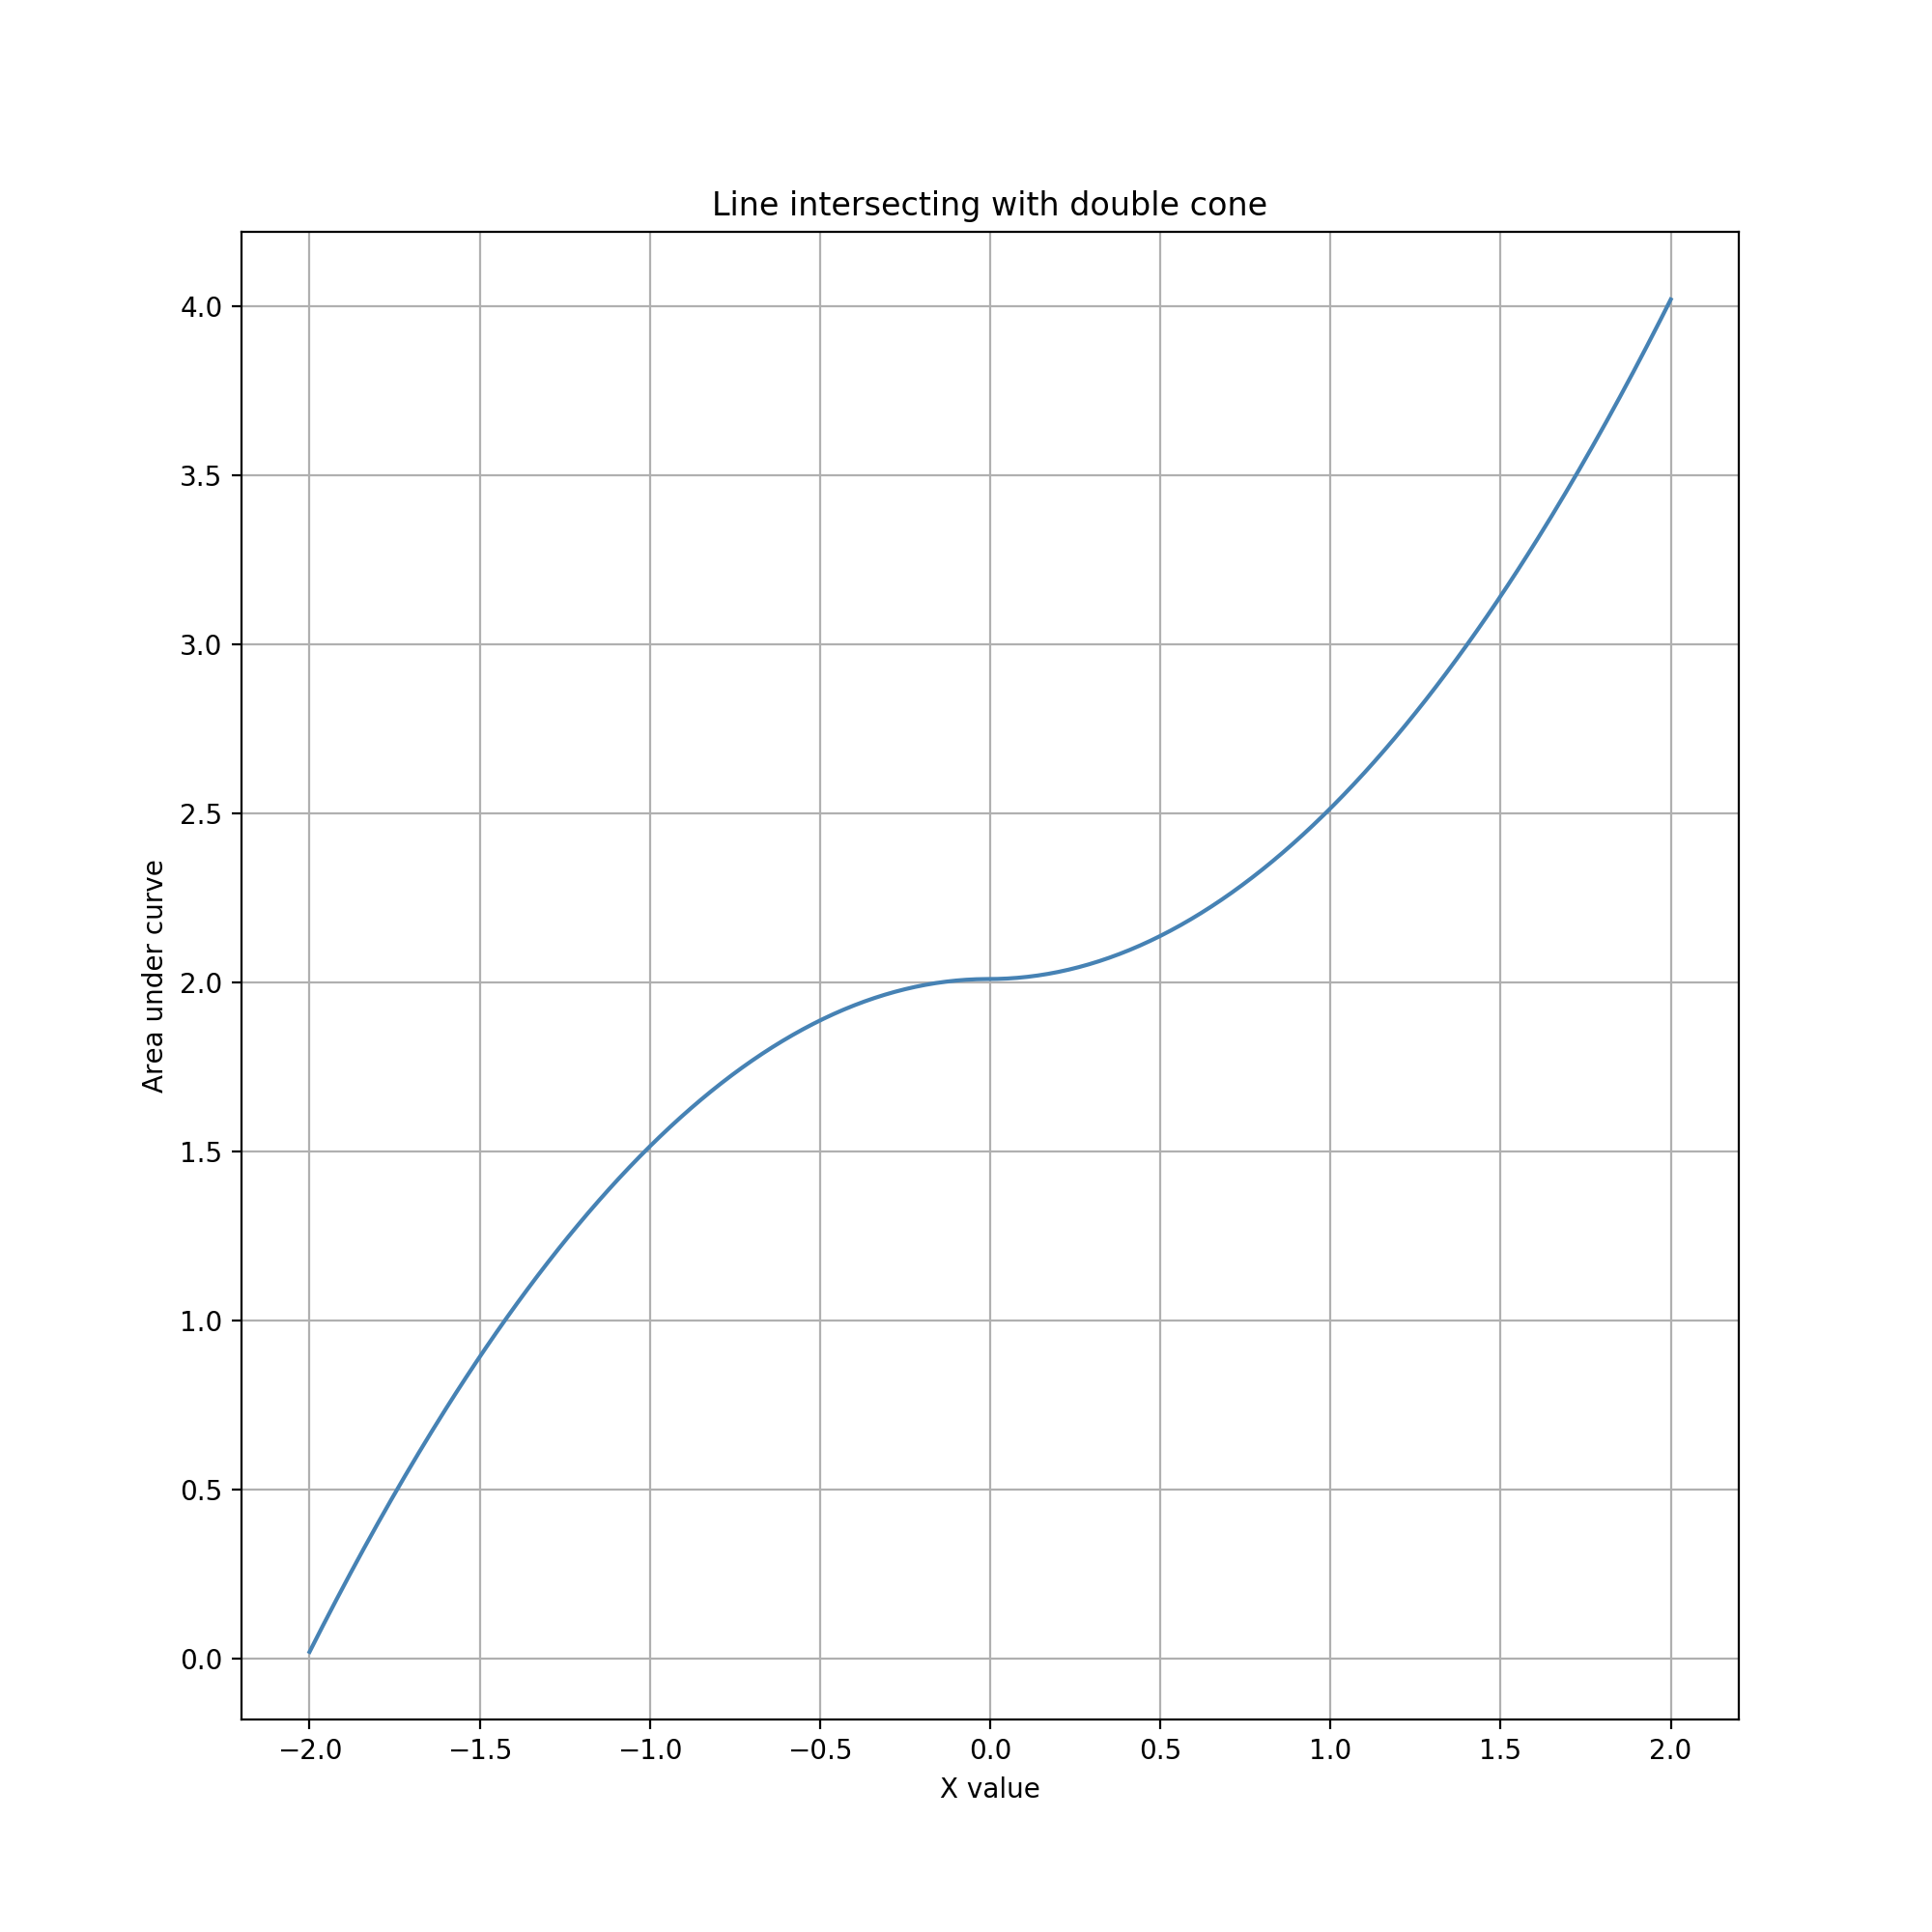
The distribution of data values is the right half of a parabola. When the line is near the apex of the cone, changes are small and precision is high. As the line moves more to the right, the area of intersection accelerates, one can quickly reach much larger data values, but with rapidly decreasing precision. While at first glance this may seem like a very costly tradeoff, in fact counts and other kinds of numbers recorded as observations in the digital humanties, when they range across multiple orders of magnitude, often require only one or two significant digits of precision. In these cases, the cone gesture can be used to maintain sufficient precision while allowing rapid adjustment over a wide range of values. (An interesting variation might calculate the data value as an inverse of the area, allowing the entry of very small fractions with similar pattern of precision across scales.)
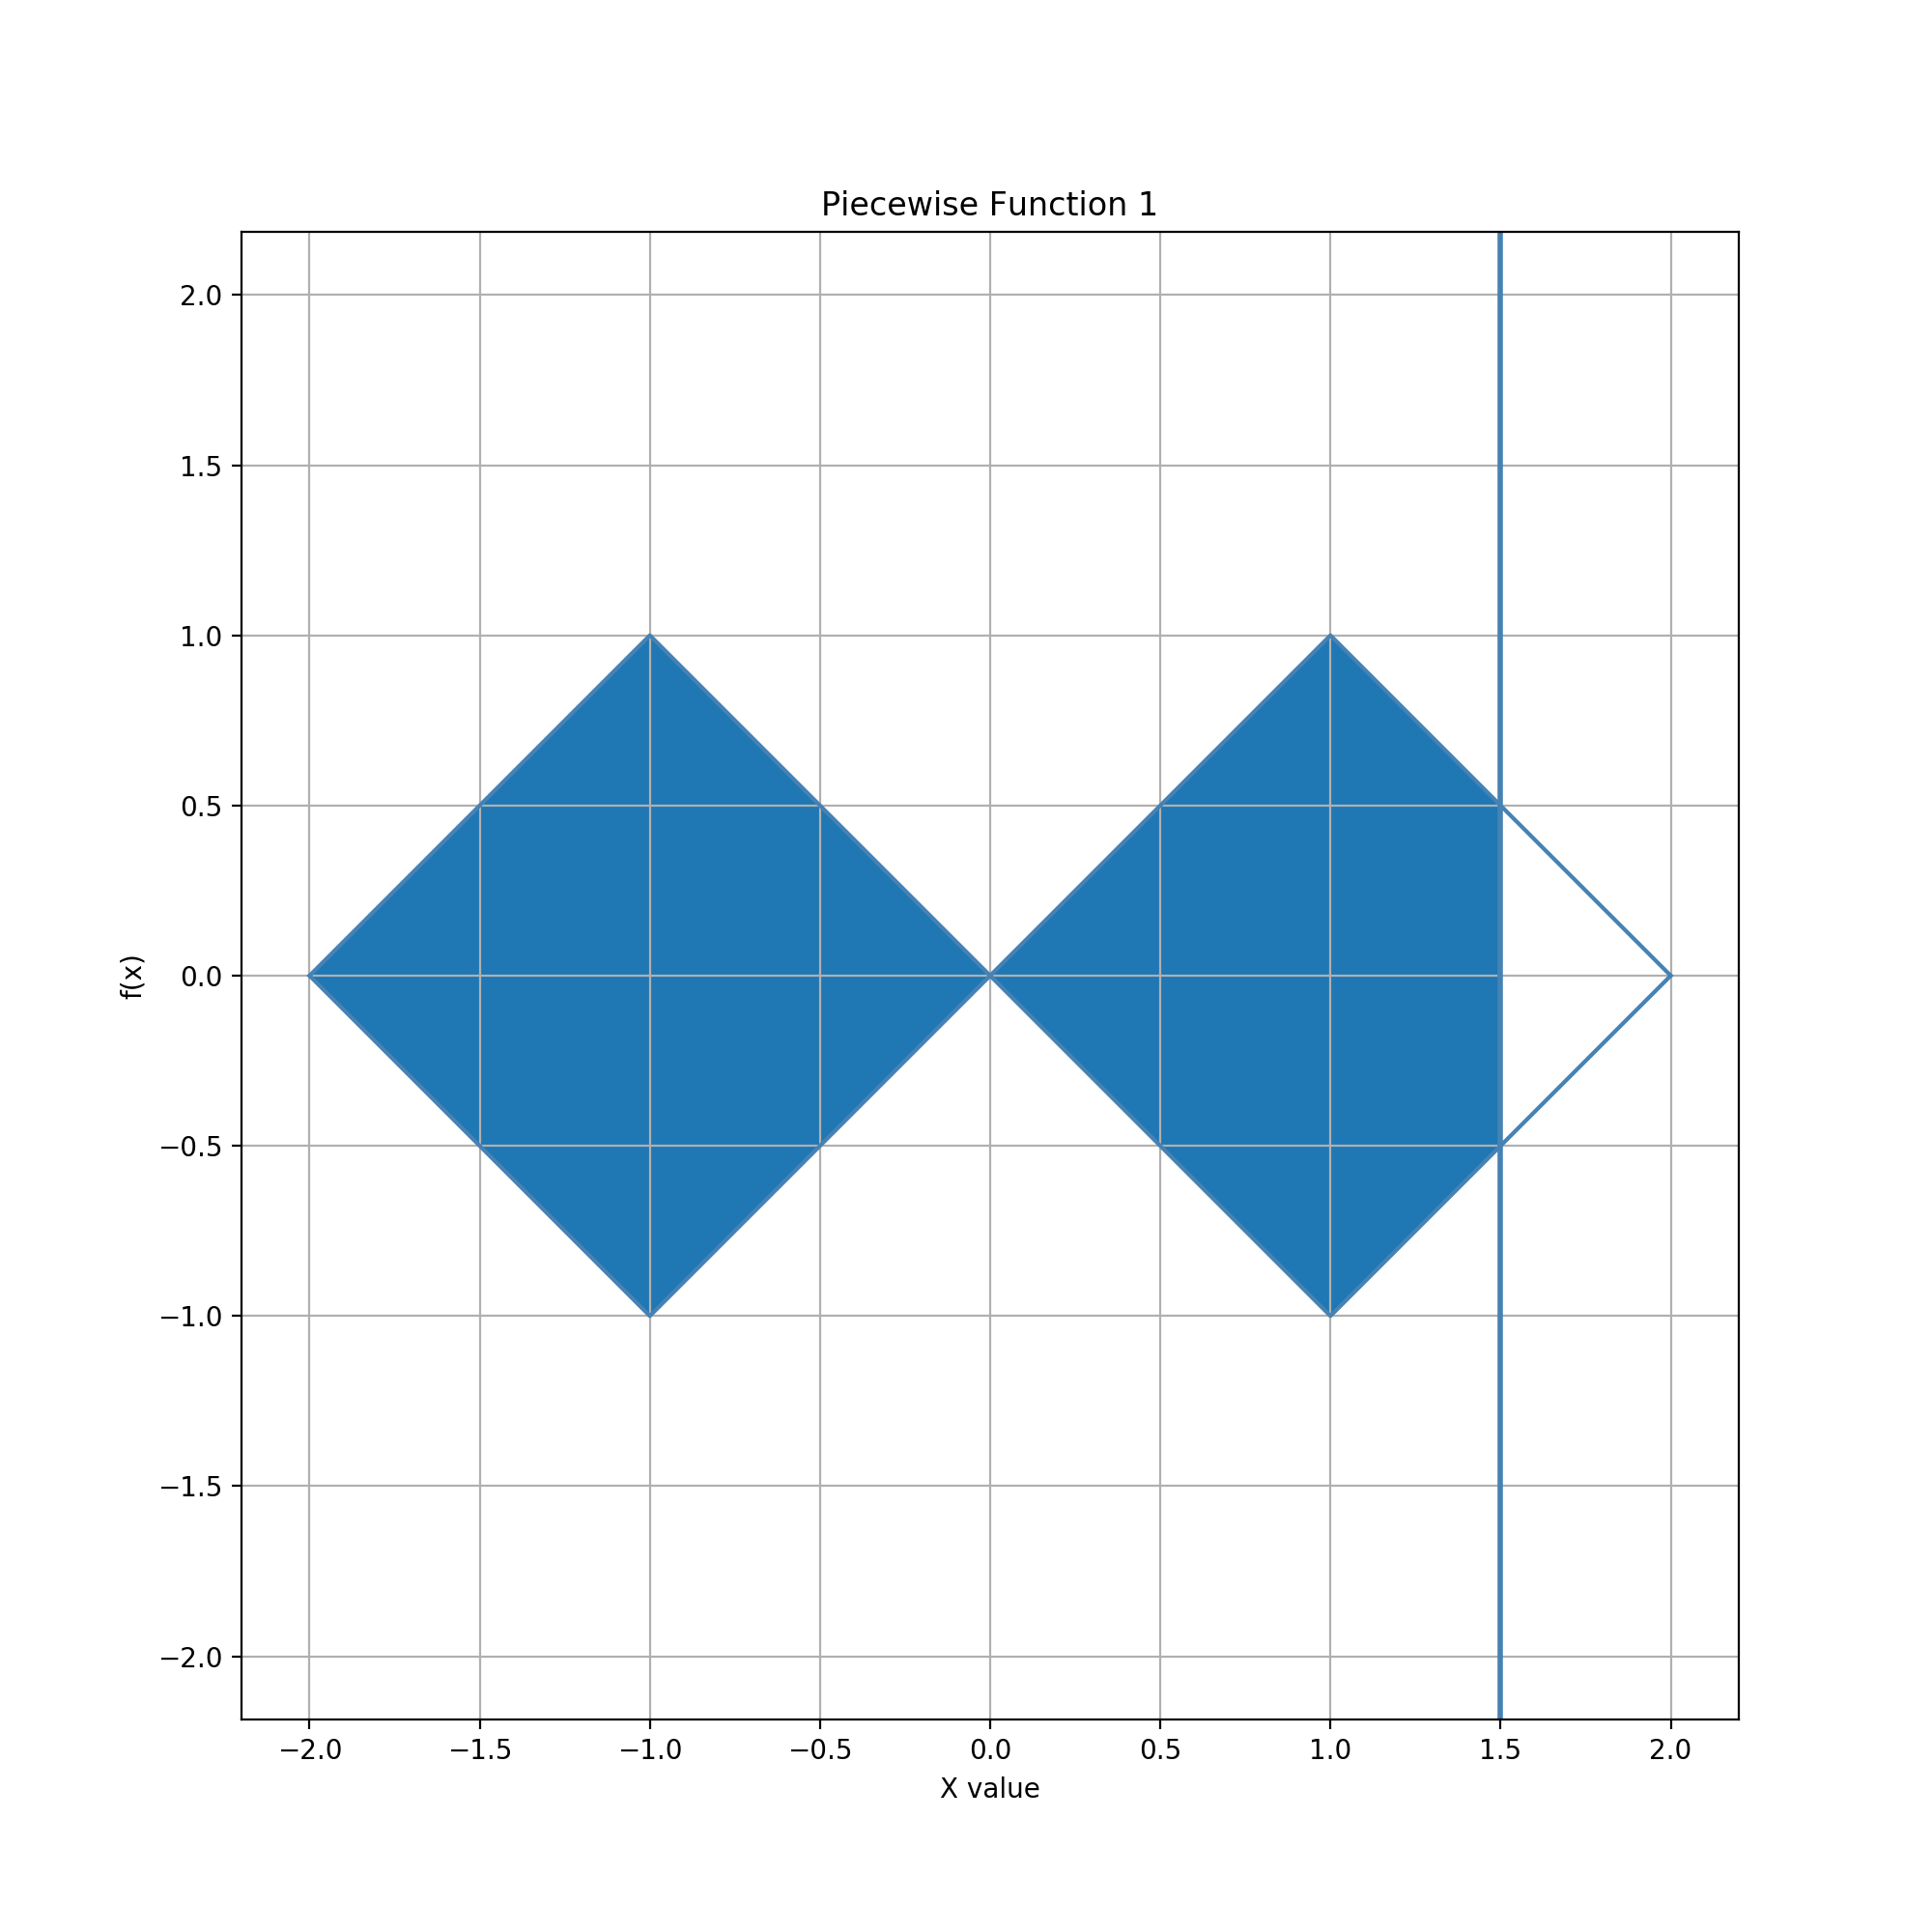
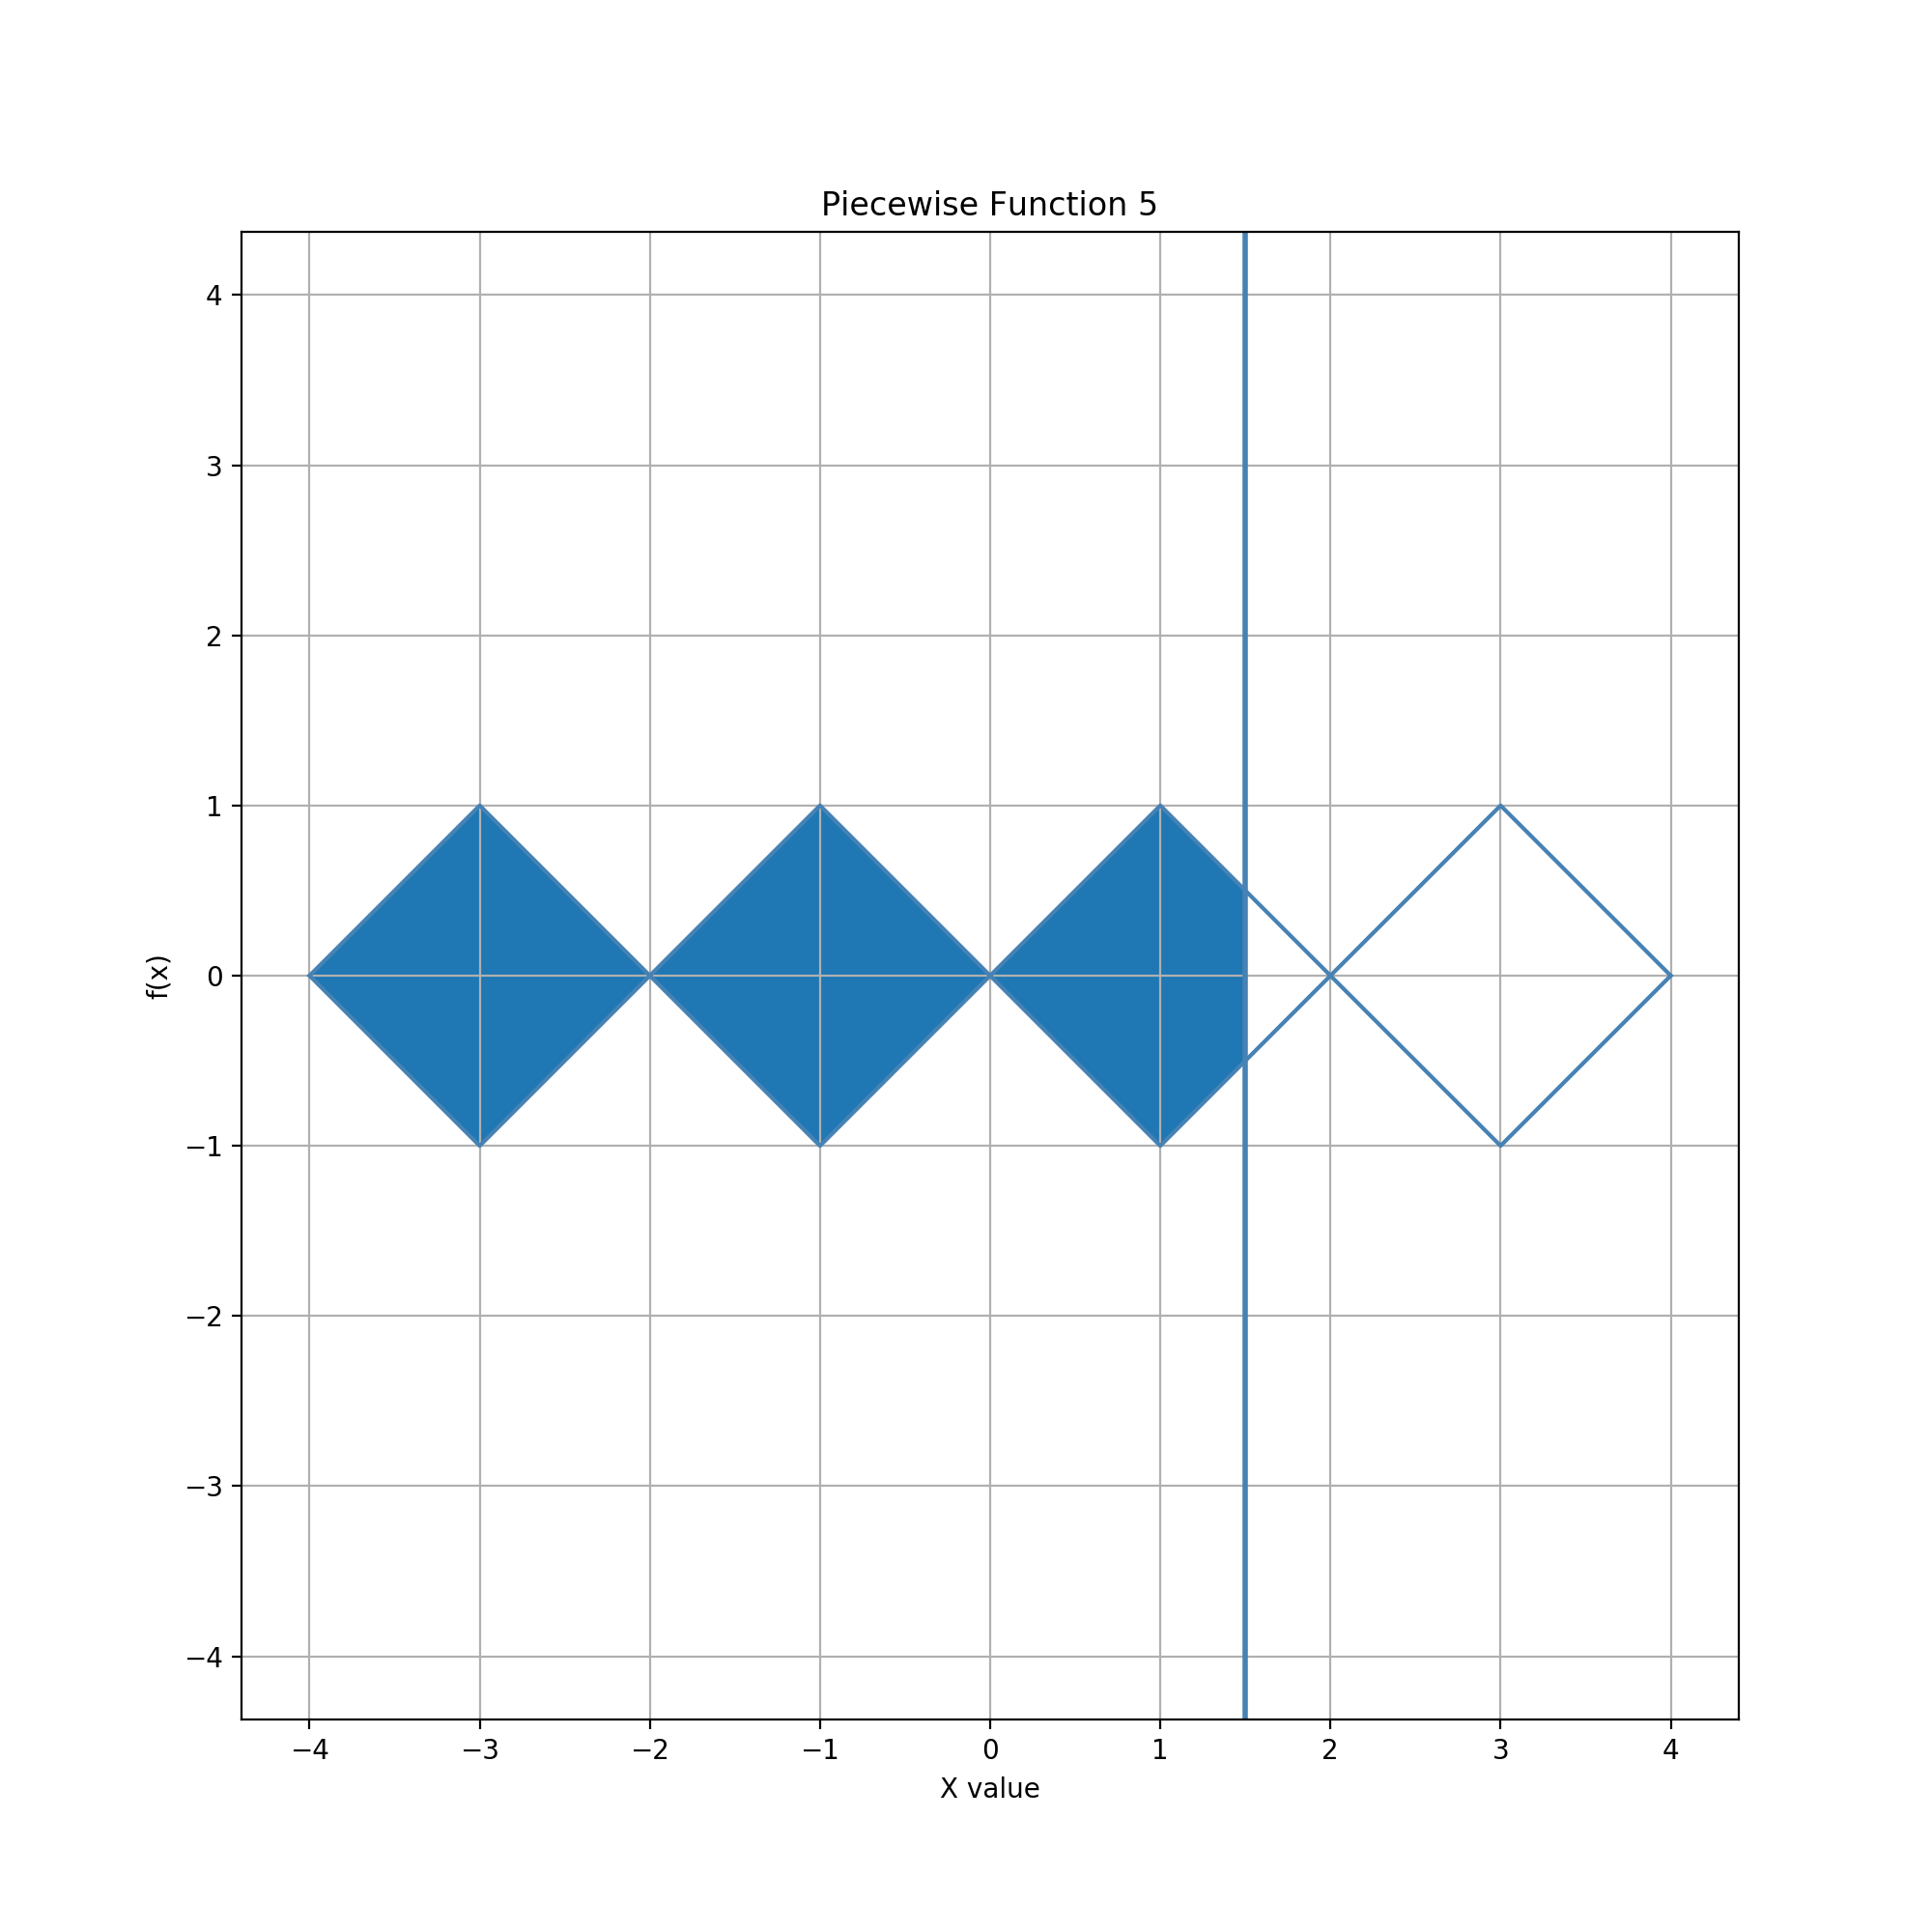
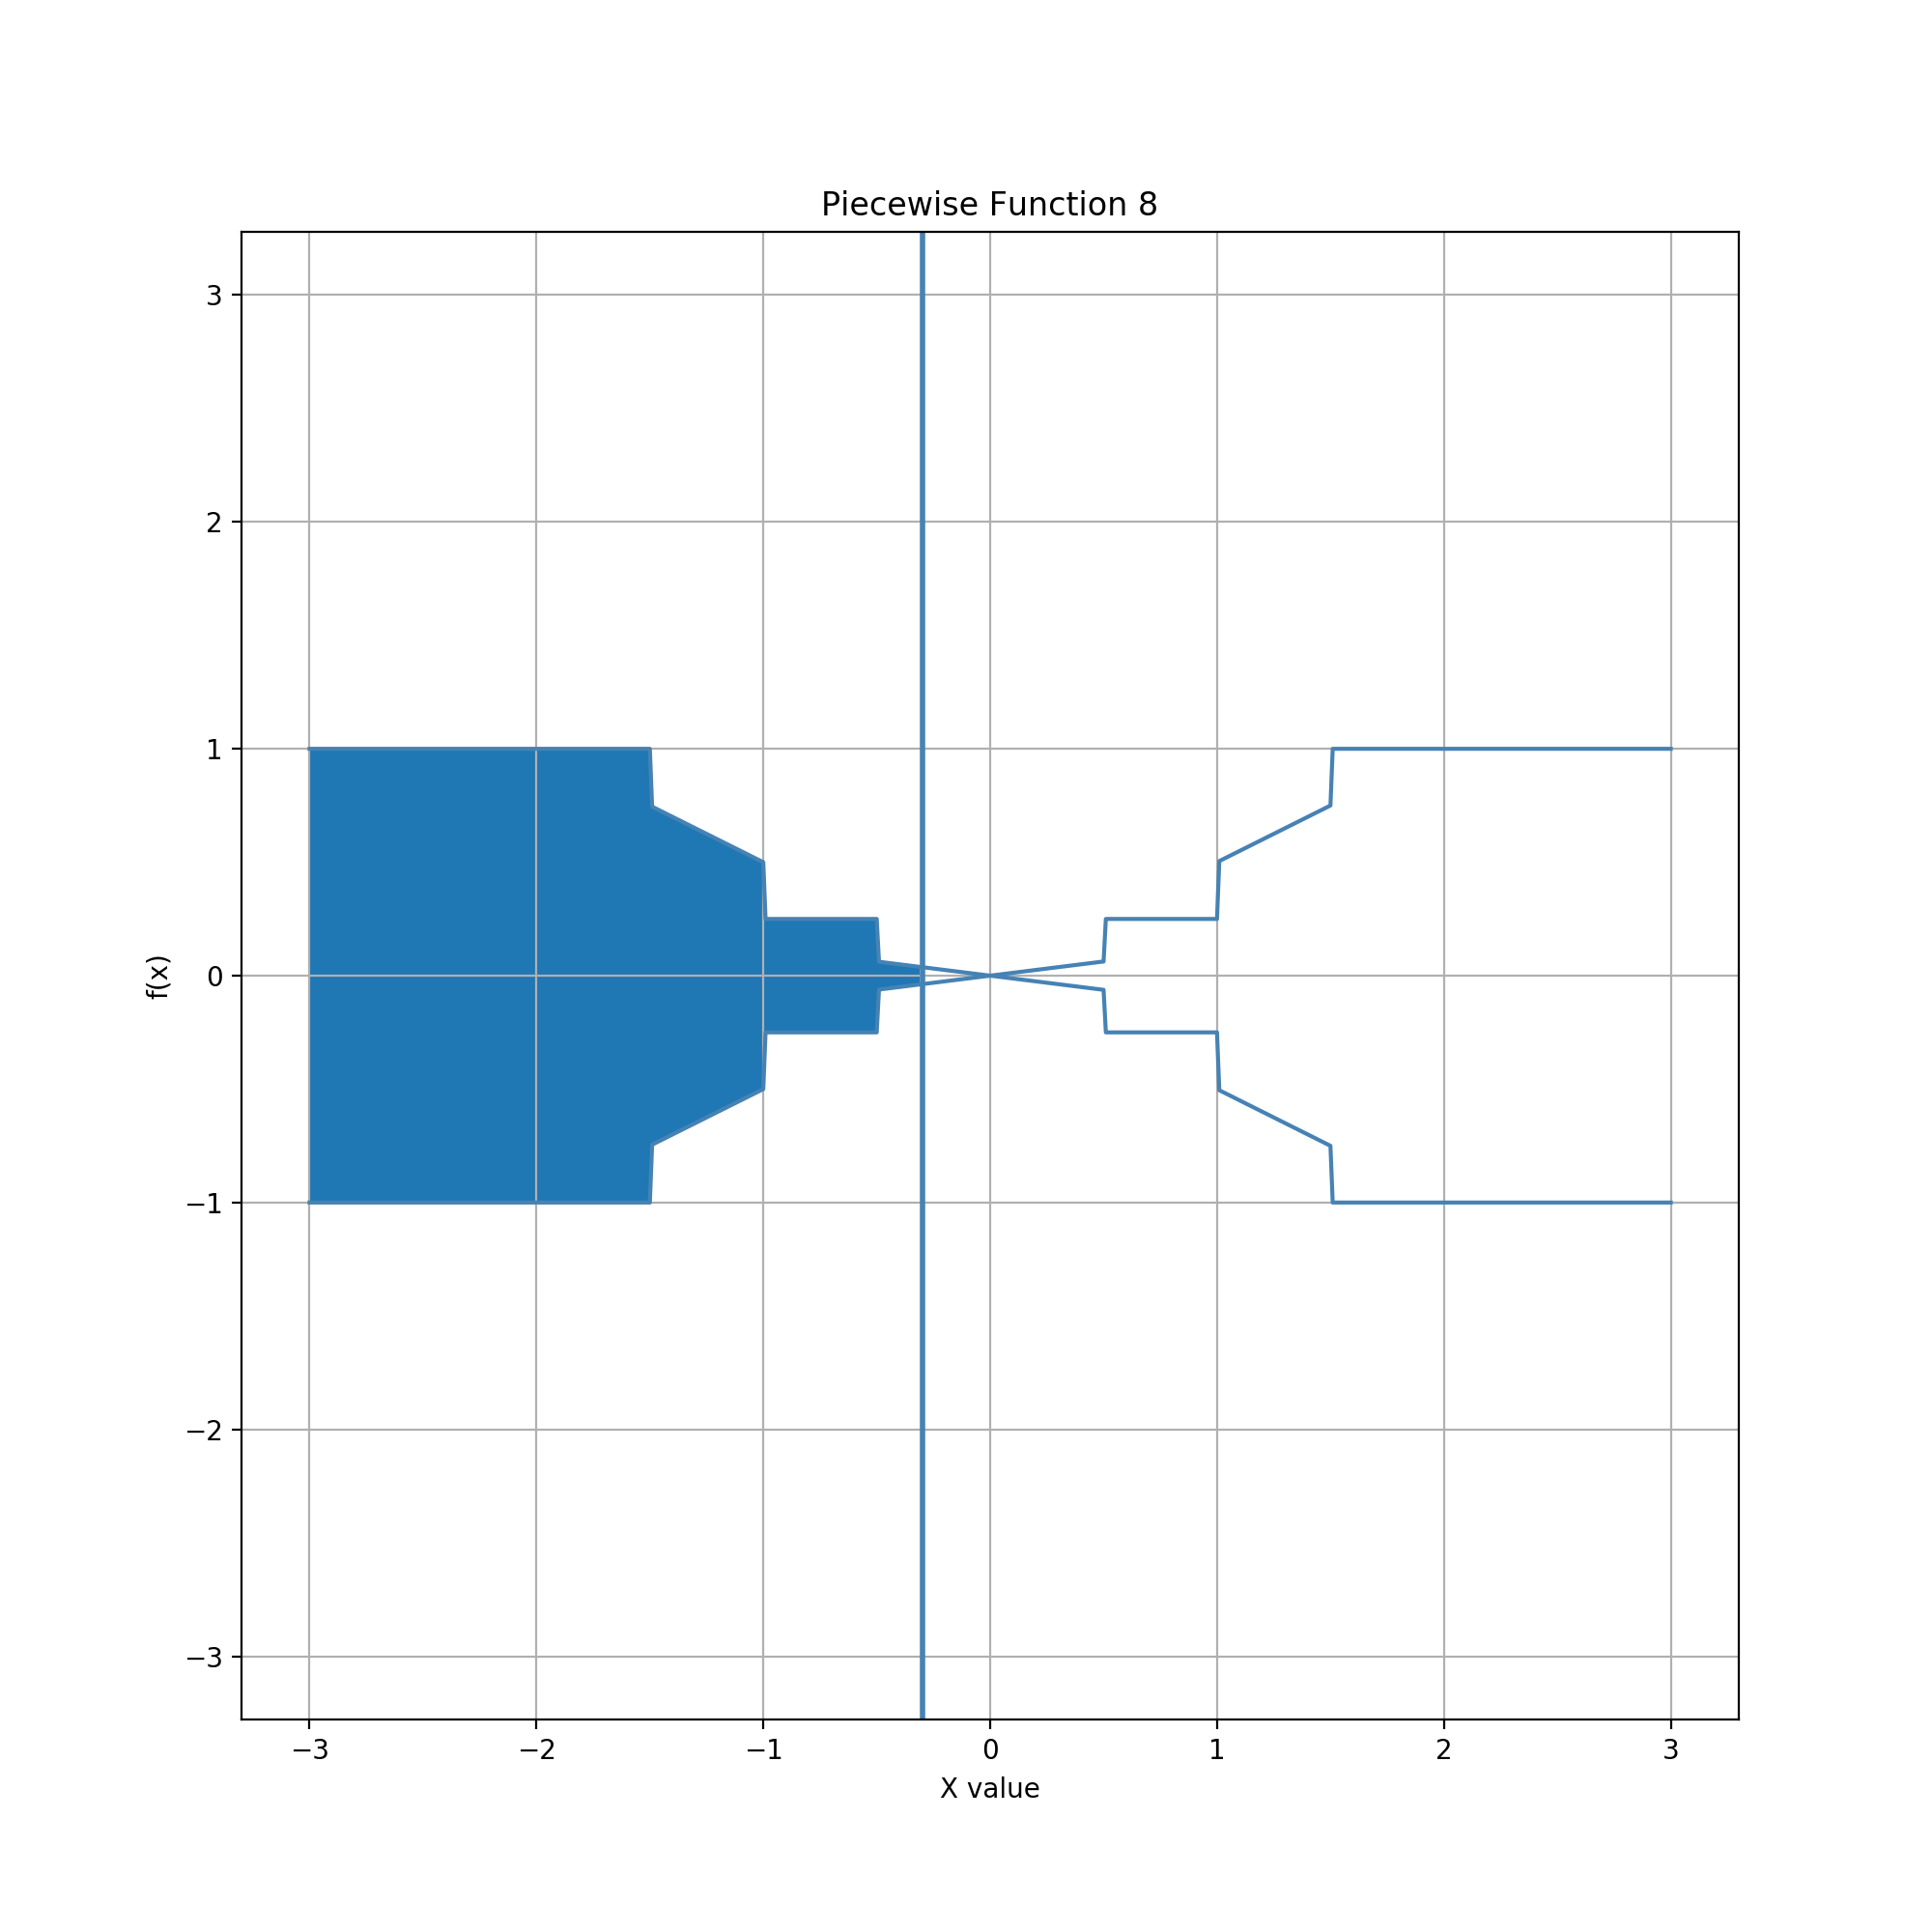
Glyph = Bowtie, Guide = Vertical Line
In this example, the glyph consists of a mirror-image pair of finite horizontal cones in the shape of a bowtie. The guide is a vertical line which can be moved horizontally. The line cuts one of the cones vertically, enclosing a region left of the line and right of the cones' mutual apex. The edited data value is the area of this region.
The area increases rapidly as the vertical line moves horizontally from the leftmost edge of the bowtie. However, as the vertical line nears the apex, the rate of change decreases and precision increases linearly. As the line moves right past the apex, the rate of change increases and precision decreases linearly, up to the rightmost edge of the bowtie. Reachable data values have a lower bound of 0 and an upper bound of 1 (the normalized area of the entire bowtie), and these values can be easily and quickly set by moving the line left or right of the bowtie.
The distribution of data values consists of two half parabolas. The graph of data values is equivalent to a vertical parabola with the left half turned downward. The curve is continuous but changes very slowly at the apex, allowing for smooth setting of data values near 0.5. This combination of geometries thus provides a distribution suitably for entering observations that occur more predominantly toward the middle of a bounded range and are generally symmetric in that range.
Alternatively, area could be calculated for the region from the apex to the line, with sign corresponding to direction left or right. The resulting data values would fall in the range of -1 to +1. The axial symmetry of the bowtie relative to line position would thus allow visual entry of both a magnitude and a parity simultaneously. The bowtie the apex provides a clear, precise location where parity changes. The same axial symmetry exists in the circle example above, but the location of parity change is harder to identify due in the top and bottom of the circle. Setting parity is quick and easy across the entire magnitude range in the bowtie example, but only so toward the ends of the range in the circle examples.
Glyph = Aster, Guide = Vertical Line
In this example, the glyph is an "aster" created by dividing a circle into four arcs, then inverting each arc around the chord connecting its endpoints. The result is a kind of "inverted" circle. The guide is a vertical line which can be moved horizontally. The line cuts arcs vertically, enclosing a region left of the line and right of the point shared by the left two arcs (and which in the original circle would have been its leftmost point). The edited data value is the area of this region.
The distribution of data values is a sigmoid-like function with a minimum of 0 and an maximum of 1 (the normalized area of the entire aster). The curve is continuous but changes very slowly at the extremes and very quickly in the middle. This is the same pattern as in the circle examples, but exacerbated due to the "inversion". Moreover, the "inversion" creates an obvious inflection point near the center of the aster, allowing easier entry of values near the middle of the range, although still with low precision.
Entry of values at the bounds is easy and quick by moving the line outside the glyph, just like with the other finite glyph geometries. Entry of values near the bounds is highly precise. Whereas the bowtie example allows more precise entry near one data value in the range, the aster example allows highly precise entry near two. This suggests refinement to design geometries with distributions that offer precise entry near multiple values, with the ability to tune where and how precise those value regimes are.
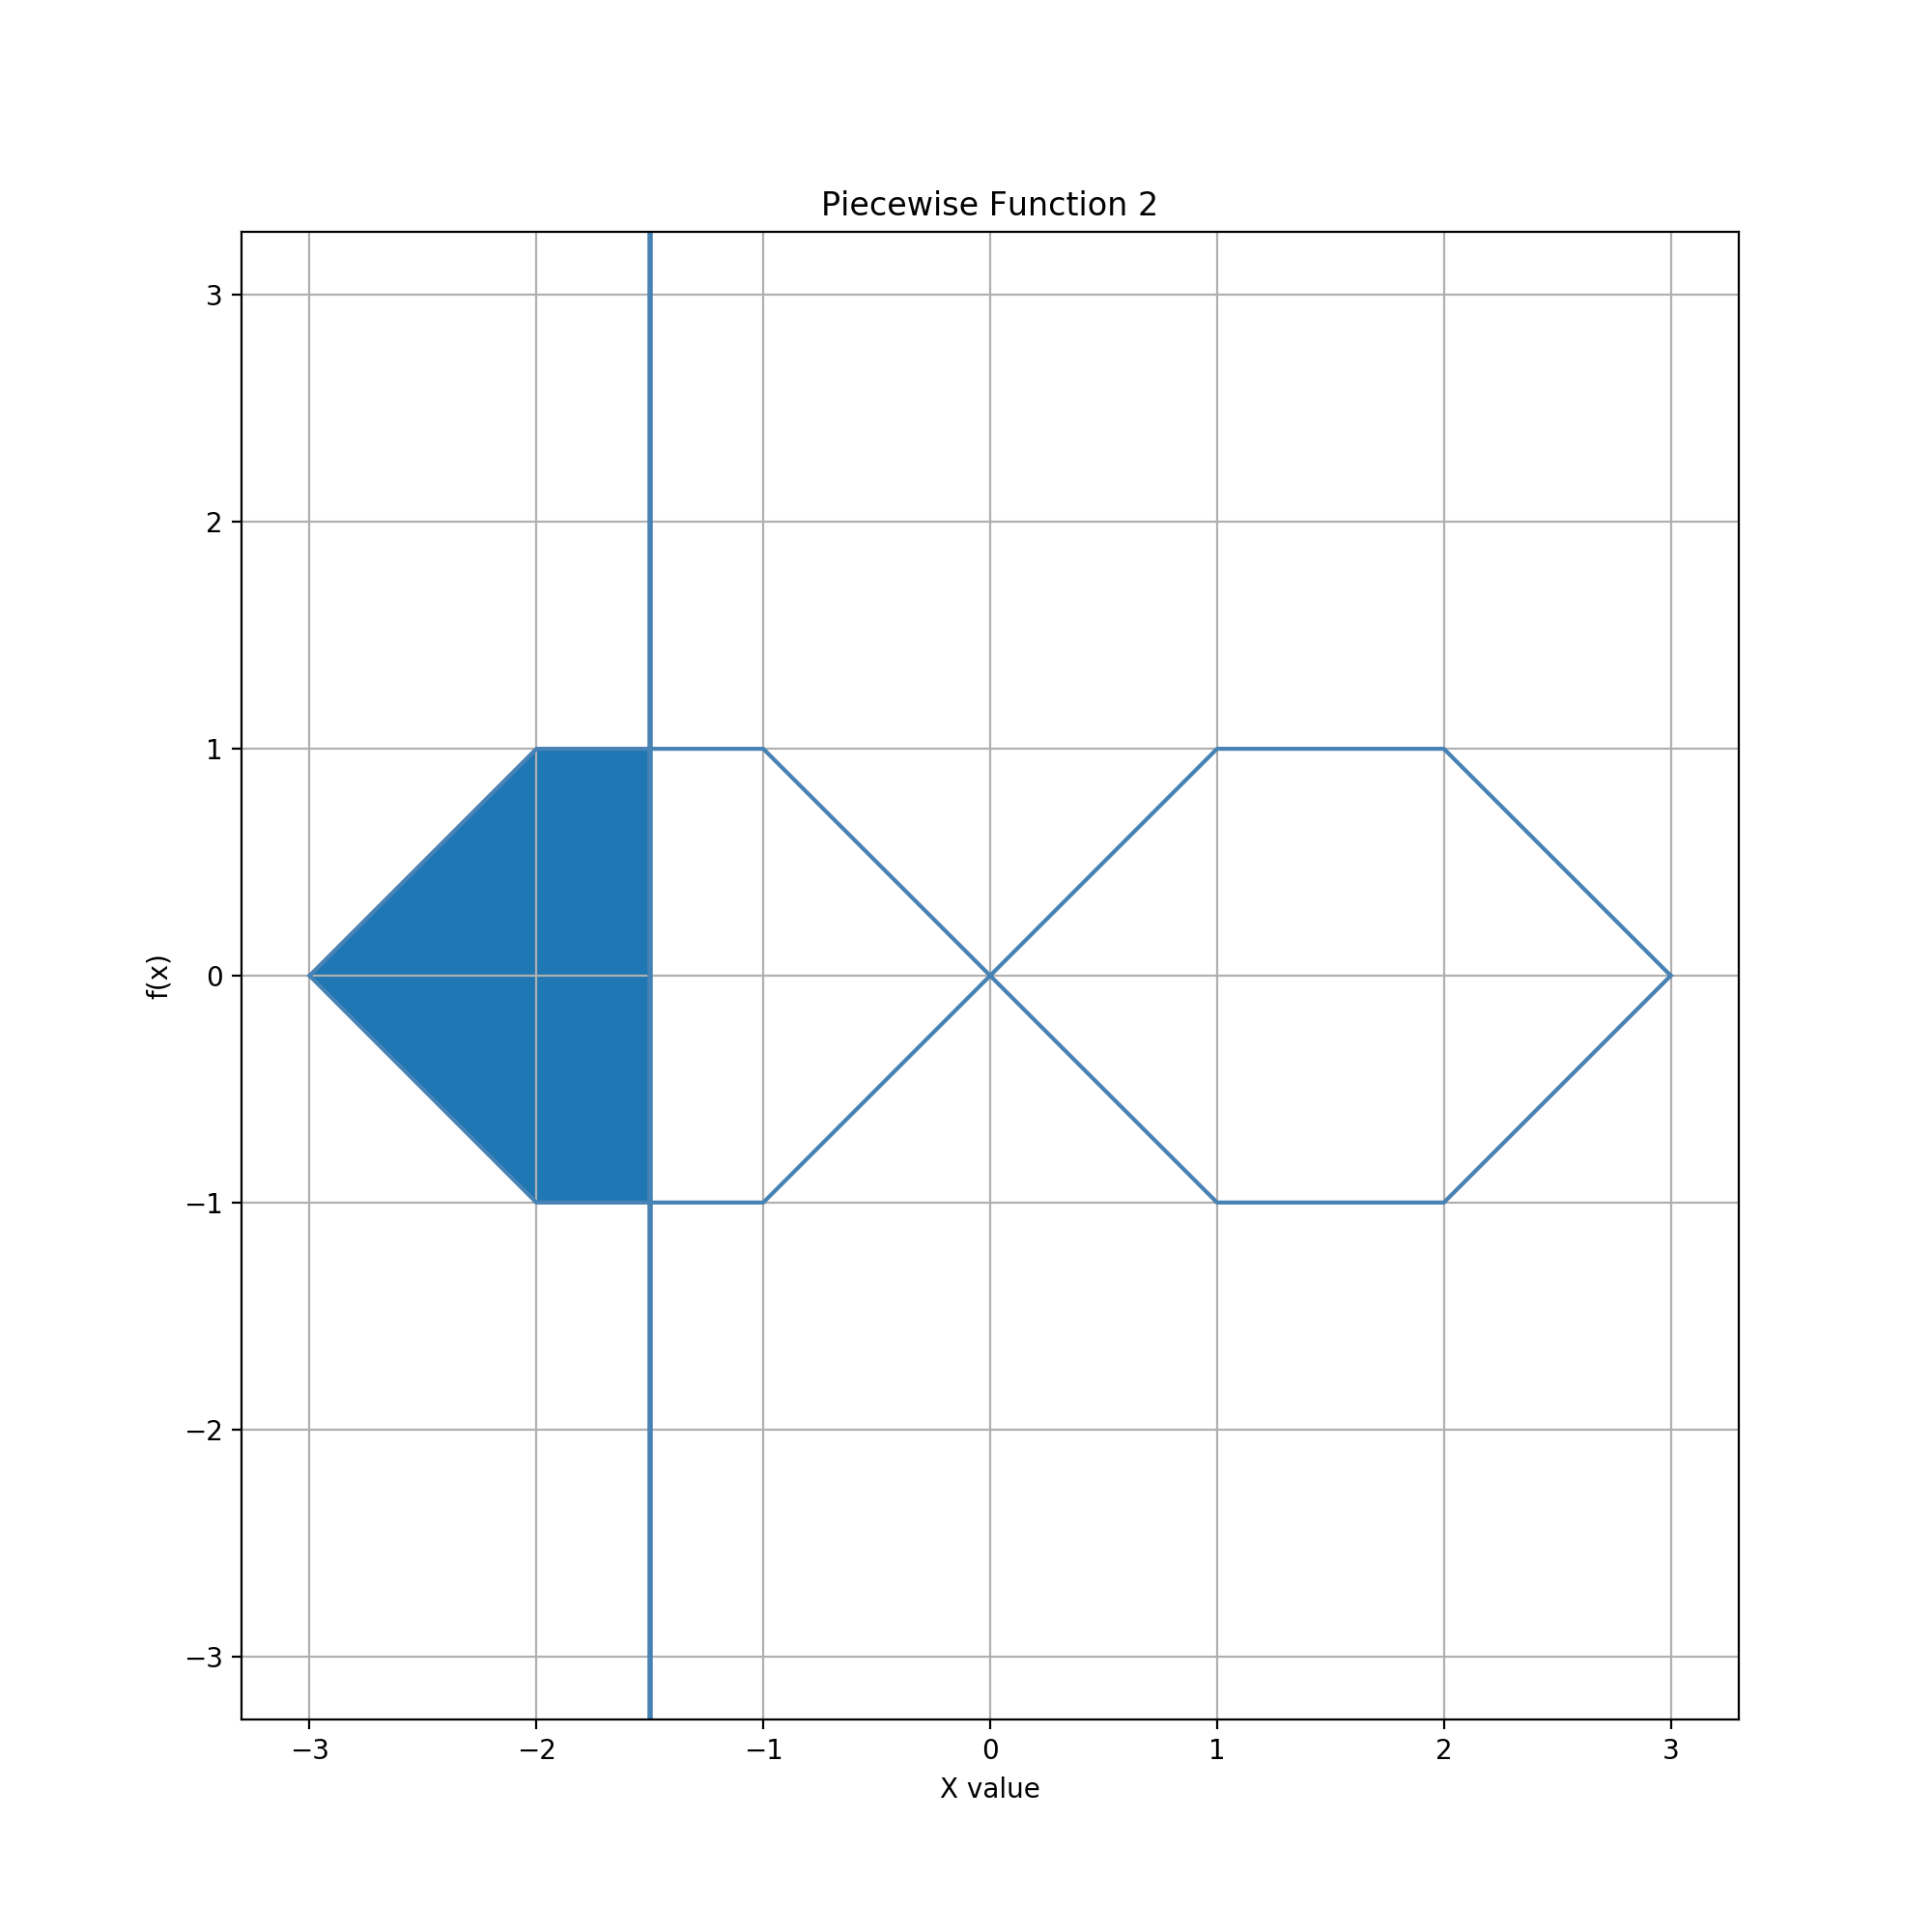
Glyph = Compound (Diamonds), Guide = Vertical Line
A geometrie provides a set of operators to calculate unitary geometric objects from others. Compound geometric objects can also be defined by simply collecting them into a group. Compound geometries often have the same characteristics as unitary geometries. For instance, a group of 2-D shapes has bounds and area determined by the union of regions of the shapes in the group.
In this example, the glyph is a pair of diamonds. The compound geometry consists of two squares, each rotated 45 degrees and positioned horizontally to touch at one mutual vertex. This geometry can also be seen as a set of four finite cones in a sequence alternating in direction right-left-right-left. It can also be interpreted as an extended bowtie that converges back to a point on each end. The guide is a vertical line which can be moved horizontally. The line cuts the diamonds/cones vertically, enclosing a region left of the line and right of the leftmost vertex of the leftmost diamond. The edited data value is the area of this region.
The distribution of data values is a multi-level sigmoid-like curve. This curve combines features of the distributions in the bowtie and aster examples. The compound geometry is finite like its components, so data values remain bounded. Entry of the bound values similarly remains easy and quick left and right of the overall shape, although in practice likely less so due to the need to move the line farther to overcome a larger overall width. Within the bounds, the distribution allows more precise entry near three values, specifically the two bounds and their average/midpoint. In between are two regimes of faster but less precise adjustment.
Glyph = Compound (Hexagons), Guide = Vertical Line

The previous examples reveal how changes in height in a glyph's geometry determines local characteristics in the accumulation of area, i.e. the distribution of reachable data values. When height changes quadratically, the curve changes cubically, like in the circle and aster examples. When height increases/decreases linearly, meaning the slope is flat but not horizontal, the distribution curve increases/decreases quadratically, like in the cone, bowtie, and diamond examples. When height is constant, meaning the slope is horizontal, the distribution curve increases linearly. Consequently, glyph designs can incorporate flat segments into geometries to create linear ranges within a data value distribution.
In this example, the glyph is a pair of hexagons. To create this geometry, each diamond in the previous example is stretched to add a flat section in its center. The width of the flat section is 1/2 of the original diamond, hence 1/3 of the created hexagon. As in the previous examples, the guide is a horizontally movable vertical line which cuts the glyph and encloses the area within the glyph to the left of the line. The center segment of each hexagon creates two linearly increasing spans in the data value distribution, one centered on 1/4 and one on 3/4.
In practice the overall visualization design and context of use can strongly affect the speed versus precision tradeoff in any of these examples. The size and aspect ratio of glyphs, as displayed on the screen, is particularly important. For the two hexagons in this example, the absolute width of the quadratic spans are the same as for the two diamonds example. The amount of horizontal space near the bound values and midpoint value is also unchanged. Thus, the precision of entering those values is preserved. However, the relative widths are smaller in the hexagon case. If the two glyphs were visually encoded and rendered to have the same overall width on screen, the apparent widths of the non-flat segments would be reduced, lowering the precision of data adjustment within them.
Glyph = Compound (Extruded Bowtie), Guide = Vertical Line

In this example, the glyph is an infinitely extruded bowtie. To create this geometry, an infinitely wide flat section is added to each end of the bowtie. This can also be thought of as extruding the left and right edges of the bowtie outward indefinitely. (The glyph can also be seen of as a variation of the hexagon example in which the middle third of each hexagon is infinitely extruded and the outermost third of each hexagon is effectively eliminated.) Like the previous examples, the guide is a horizontally movable vertical line which cuts the glyph in two. Unlike the previous examples, but like the variant mentioned in the finite bowtie example, the area is defined by the region between the line and the center point of the bowtie. The area and direction determine the magnitude and sign of the edited data value. (Note: The figures above depict the finite case. The infinite case looks the same except to shift the center to origin, fill only outward from the center, and extend the distribution curve infinitely in both directions.)
By stretching flat segments indefinitely, the distribution of data values changes linearly everywhere except within a small subrange of values near zero. Precision is constant except within that subrange. This dichotomy suggests gesture designs to accommodate cases in which data types consist of meaningfully piecewise subtypes, such as for types that involve different units at different scales. For instance, local changes in population due to migration might be recorded exactly at values below 1000, but in thousands above that. For historical populations, most but not all edits might involve very small numbers and only a few in the thousands. An extruded bowtie could be used to provide equally sufficient precision down to 1000 then increasing precision for entering closer to 0 (whether positive or negative).
Glyph = Compound (Stretched Diamonds), Guide = Vertical Line
In this example, the glyph is an infinitely stretched pair of diamonds. To create this geometry, the outermost vertex of each diamond is pulled out to infinitely, stretching its outermost edges outward. The result is a compound geometry comprising a bowtie and an envelope bounded by +1/x and -1/x for |x|>1. The guide and the area-to-data-value mapping are the same as in the extruded bowtie example.
The graph of reachable data values is still continuous, and has decreasing precision outward from zero while the line is inside the bowtie. Outside the bowtie, speed of adjustment slowly increases and precision of editing slowly decreases logarithmically; accumulation along the envelope effectively integrates 1/x.
Using only the positive half of the glyph geometry could be useful for entering durations on calendar timescales. For instance, it is customary to express age in months for infants and years for children and adults, with a transition typically at 24 months / 2 years. It is also possible for adults to live beyond 100 years, and there is no definite limit. A stretched diamond glyph would limit entry to positive values, show when month entry transitions to year entry, and provide gradually increasing precision of entry toward higher ages.
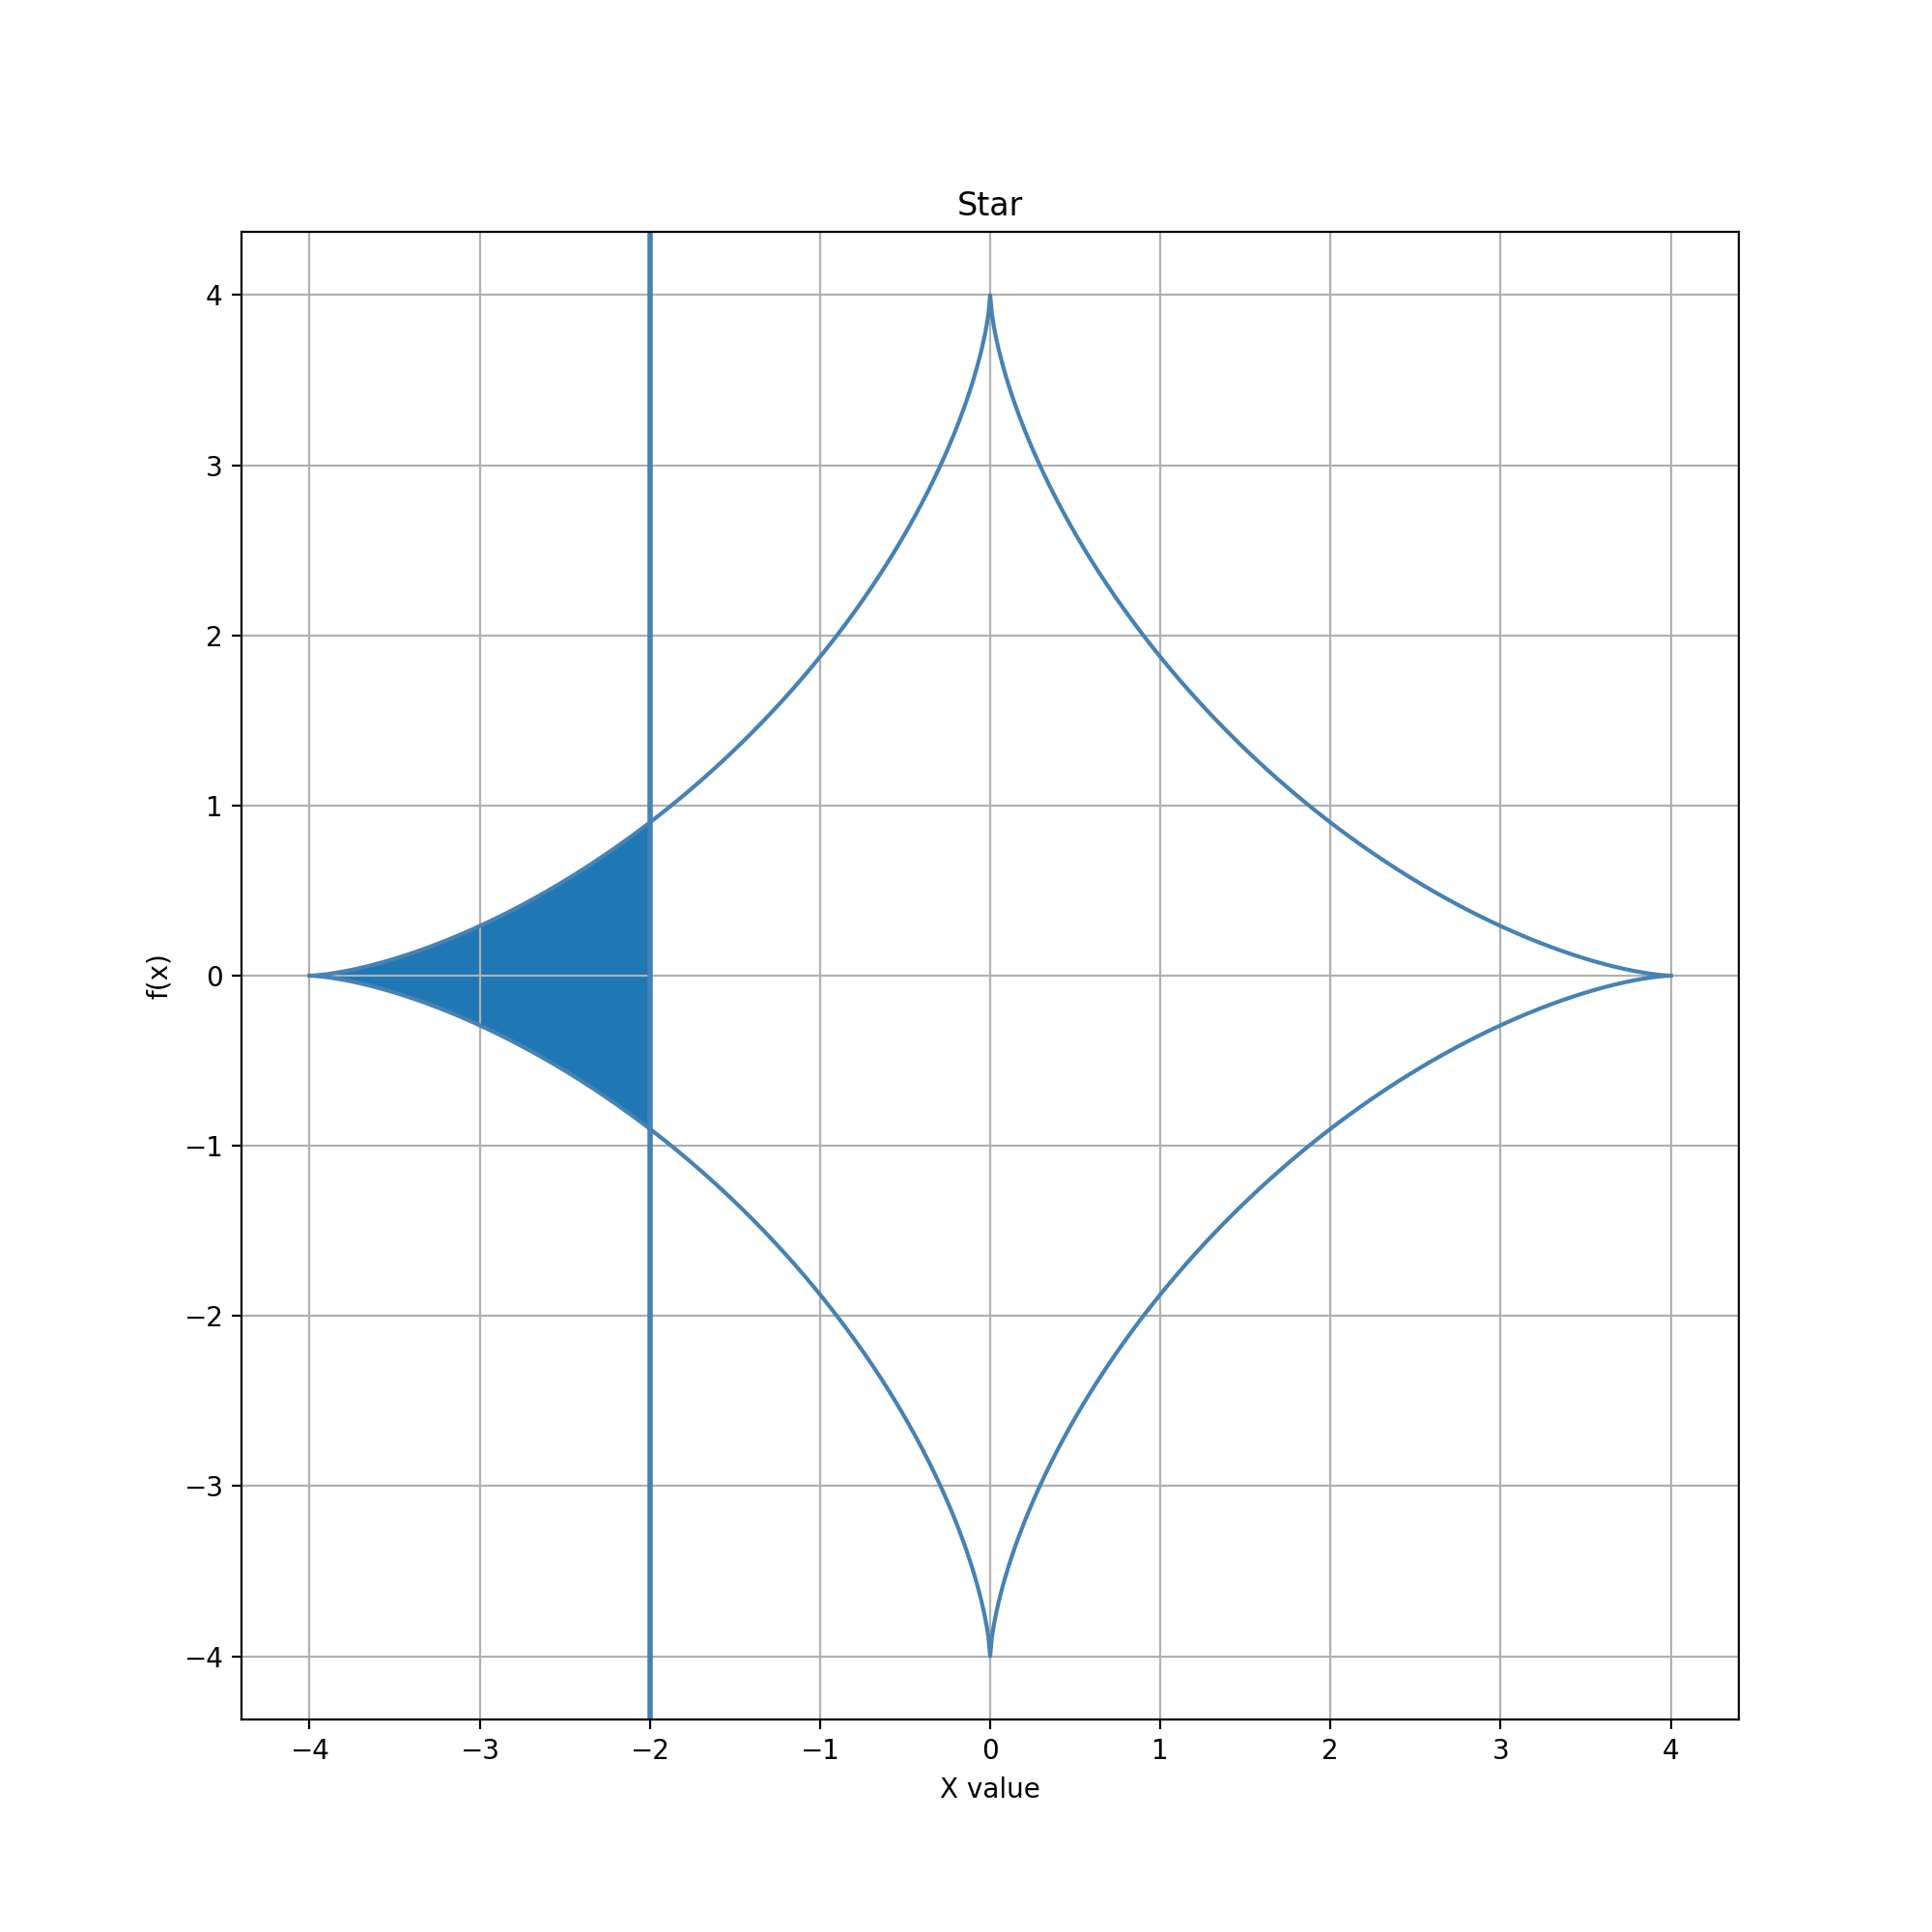
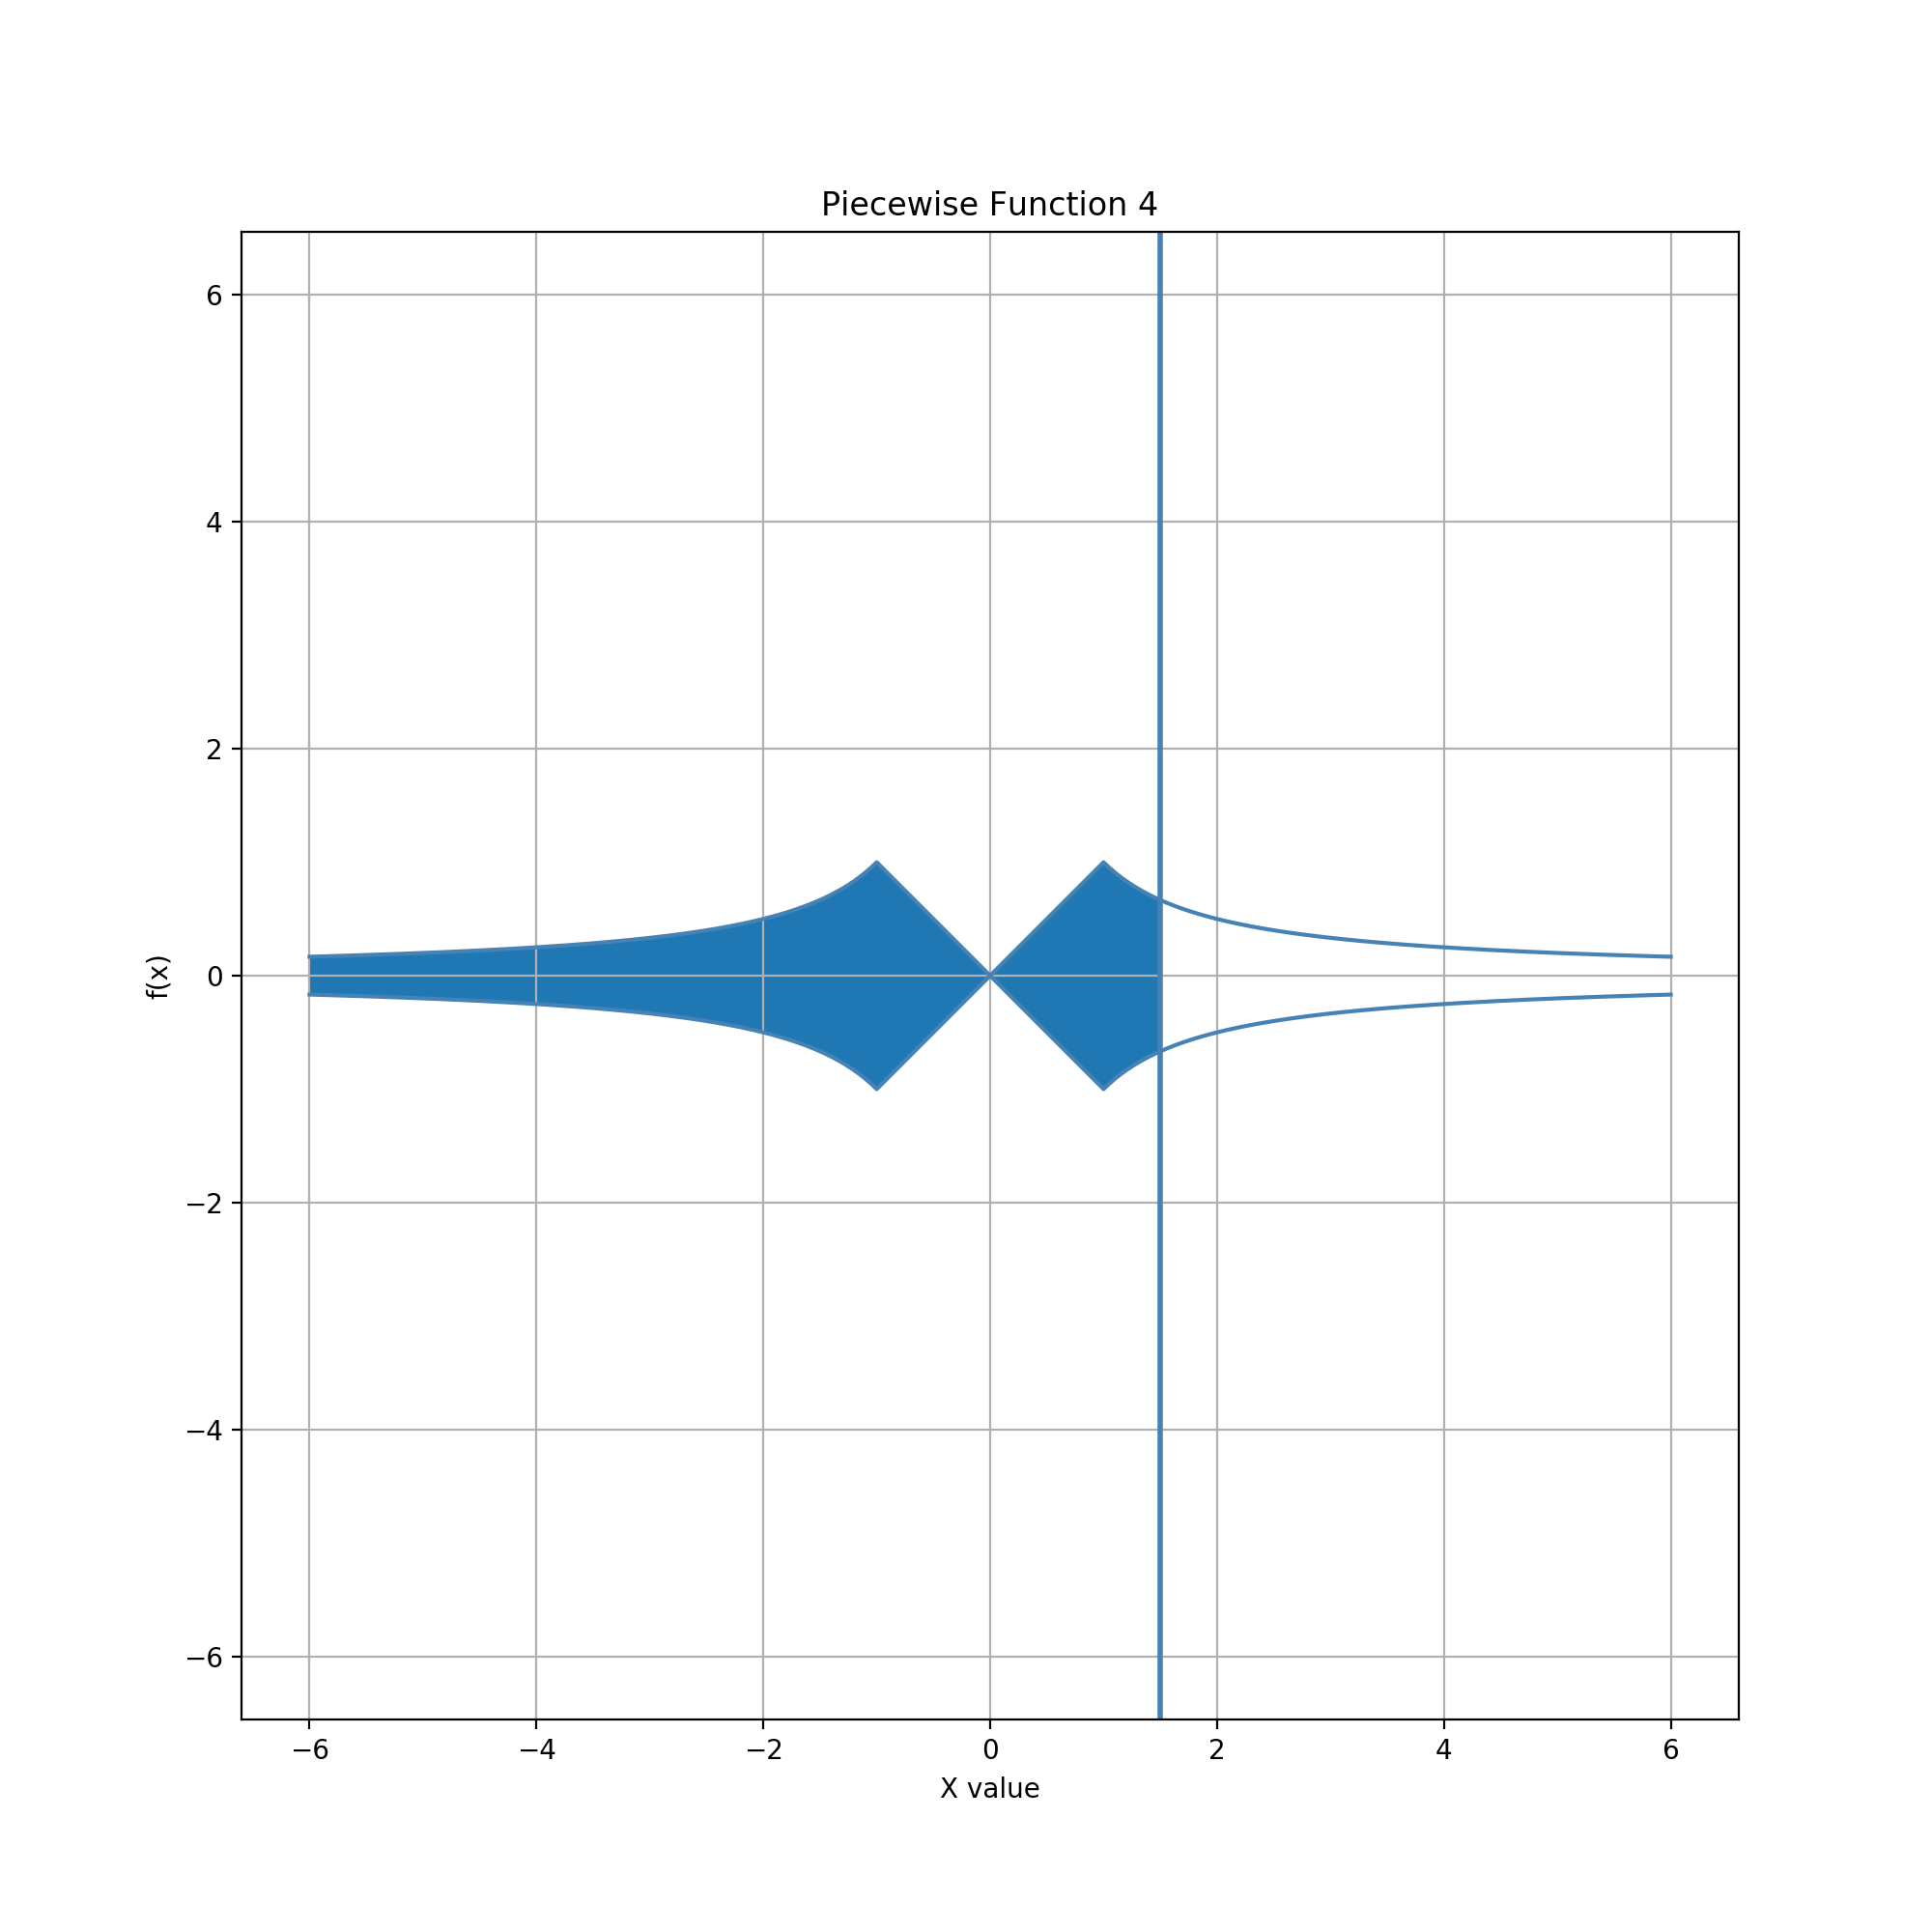
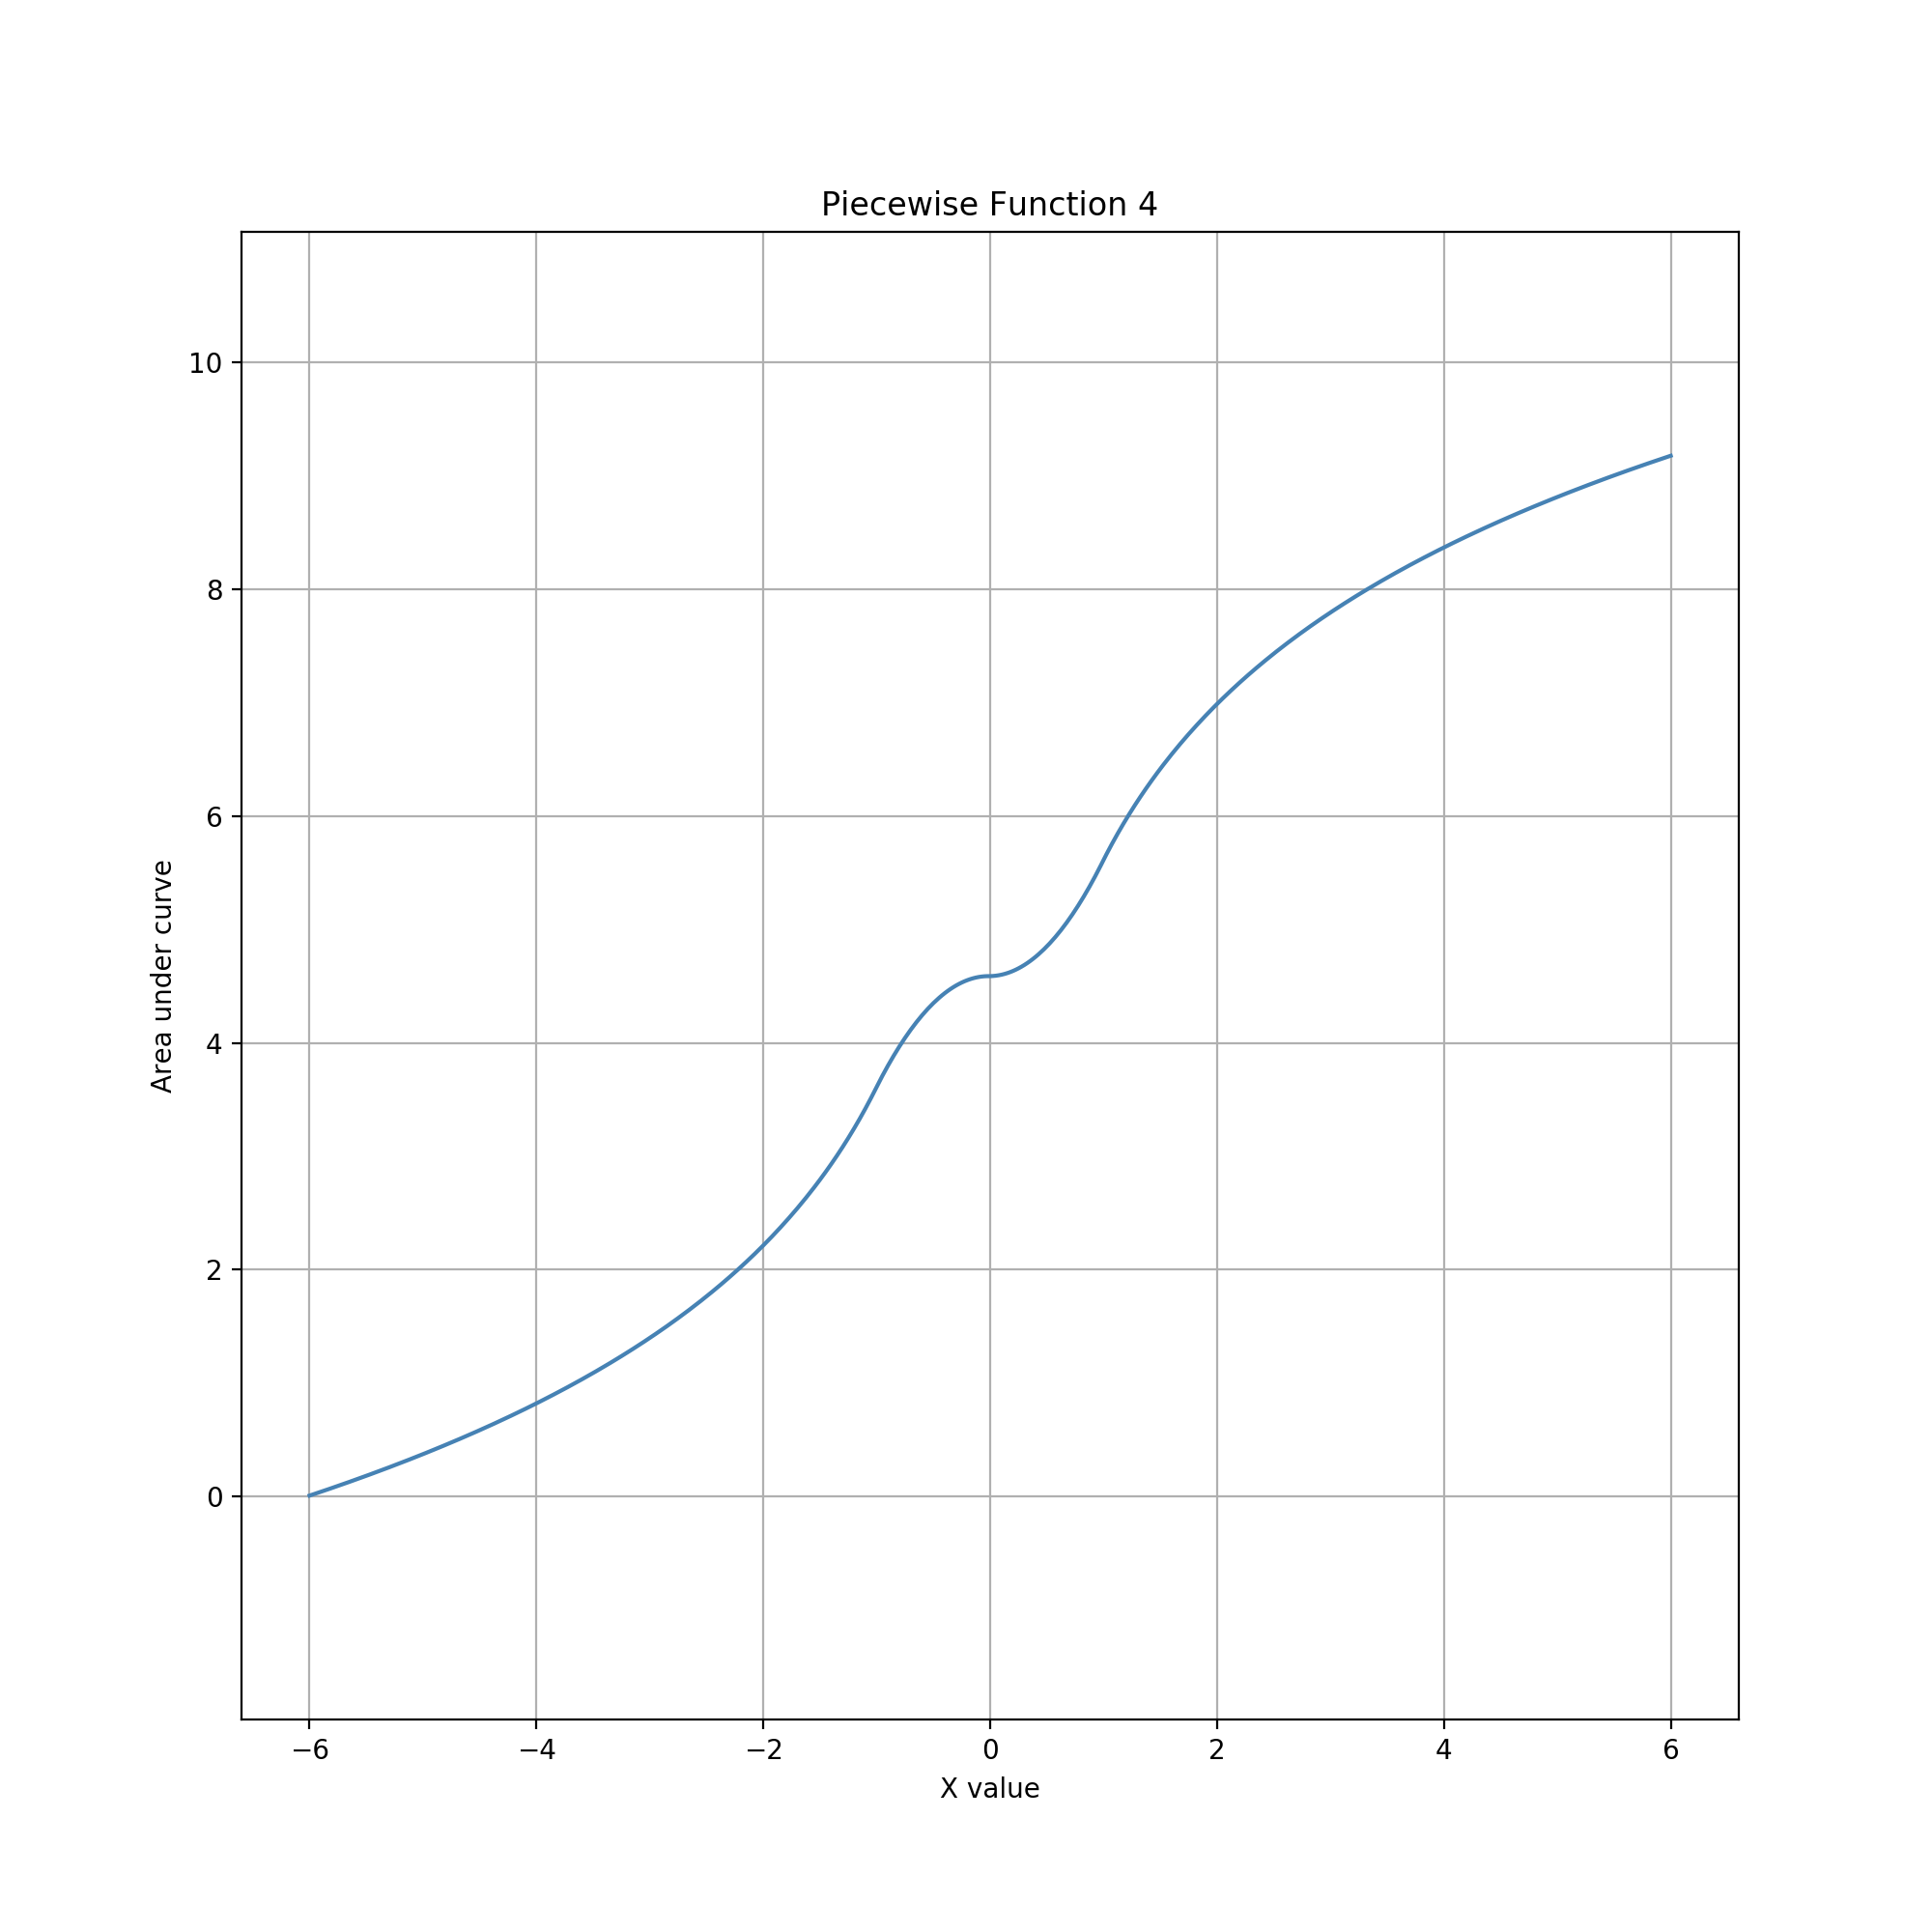
Glyph = Cusps, Guide = Vertical Line
In this example, the glyph is defined by the envelope between -1 / log10(|x|) and +1 / log10(|x|). The guide and the area-to-data-value mapping are the same as in the extruded bowtie and stretched diamond examples. The two functions intersect at two points, x = -1.0 and x = 1.0. This produces a segmented look similar to the two previous examples; however, the segmenting results from deriving a 2-D region from two 1-D curves, rather than summing existing 2-D regions into a group. The two infinite segments on the ends — the U-shaped regions extending horizontally outward — are nevertheless visually simple. Despite subtle mathematical differences, they serve the same general purpose, indefinitely accumulating area, as the corresponding outer segments in the previous two examples. Their visual character and pattern accumulation roughly parallel the finite examples circle, diamond, and aster.
In contrast, the middle segment is horizontally finite but vertically infinite. The logarithmic function has a singularity at x=0 which creates (as a rendering artifact) the visual appearance of a cusp at the center of the glyph. Interestingly, the total area of the segment is finite (4 / ln(10)). Consequently, the middle segment can be used to accumulate area either outward (as we consider here) or from the glyph ends (if the outer segments were truncated to finite length, as the figures above suggest).
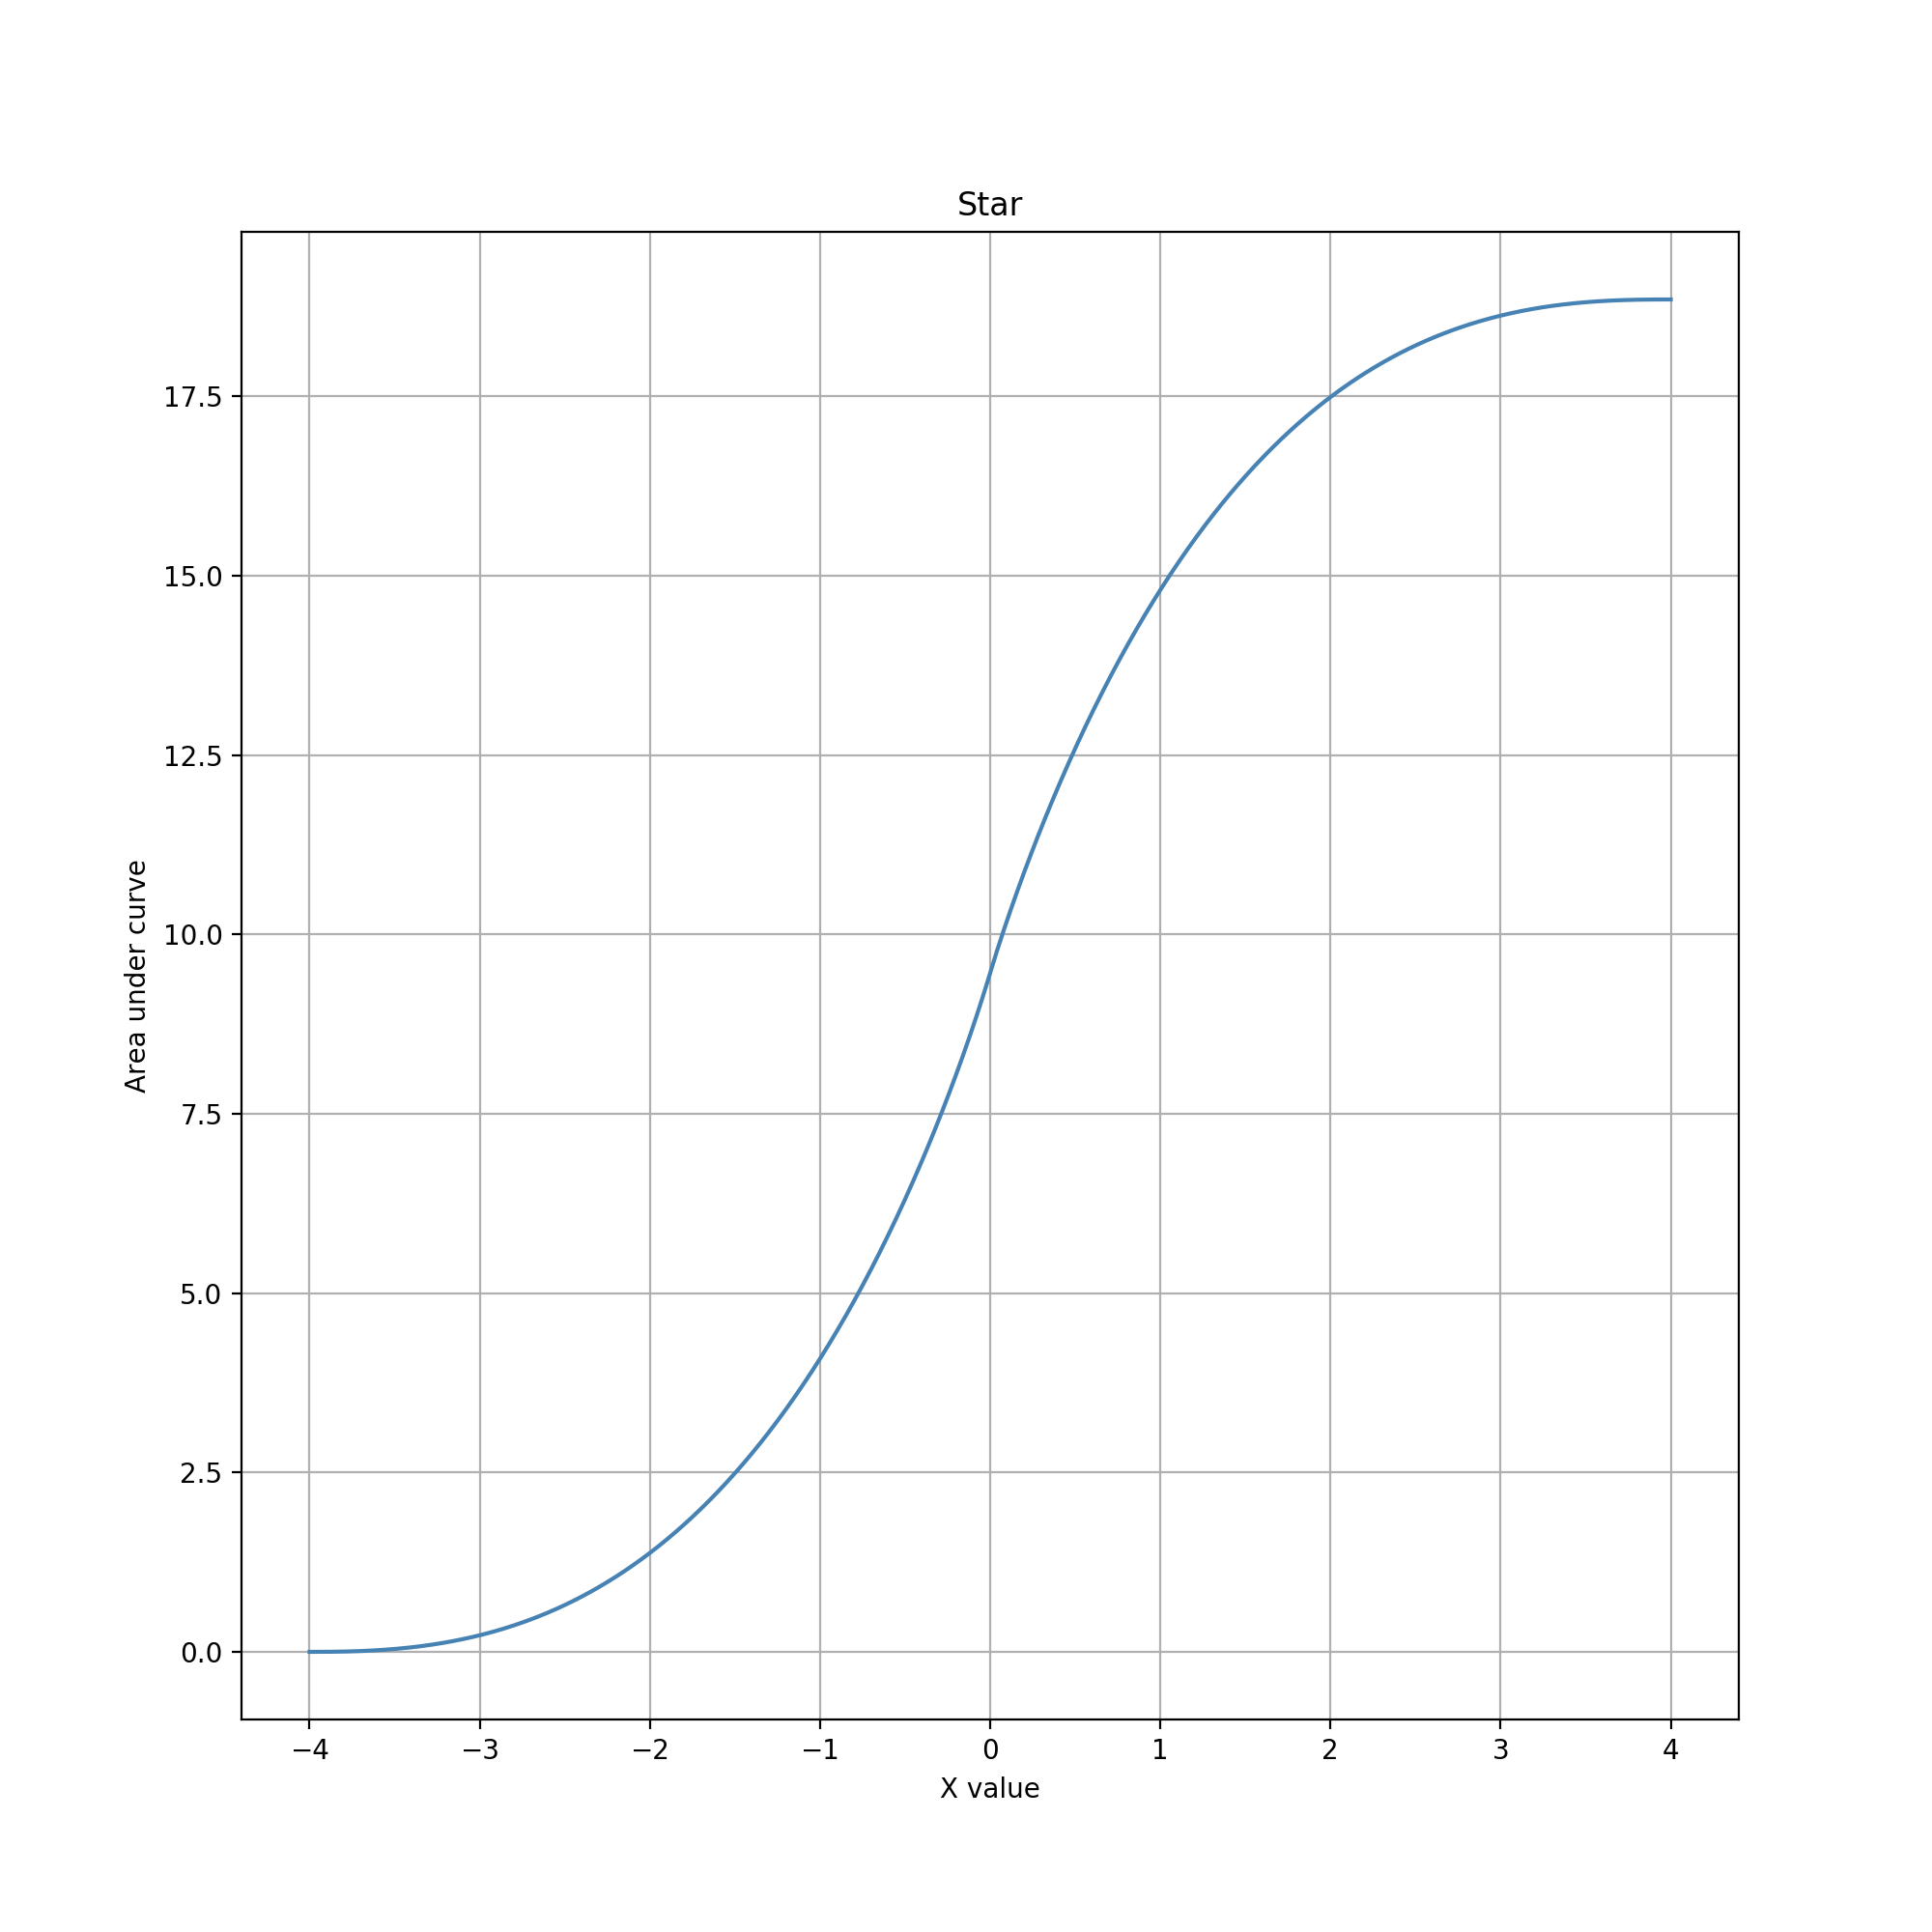
Near x=0, the cusp causes sharp increases in accumulation and extremely low precision near x=0. This behavior is the opposite of those in the previous two examples. (The overall distribution curve appears strikingly similar to a diagonal (x=-y) inversion of the stretched diamond case. This similarity makes some intuitive sense given the derivative-integration duality of 1/x and log(x), but closer inspection reveals differences in the middle segment, which results from the use of a third function for the bowtie in the stretched diamonds case.) Values near x=0 are much harder to choose, making that point something of an interactive "repulsor" rather than an "attractor" for editing. This characteristic might be useful for editing constrained data types that have values one can get very close to, but shouldn't pick exactly. This could be a value in a range that is open on one or both ends, or a value that must be postive but can otherwise be arbitrarily small.
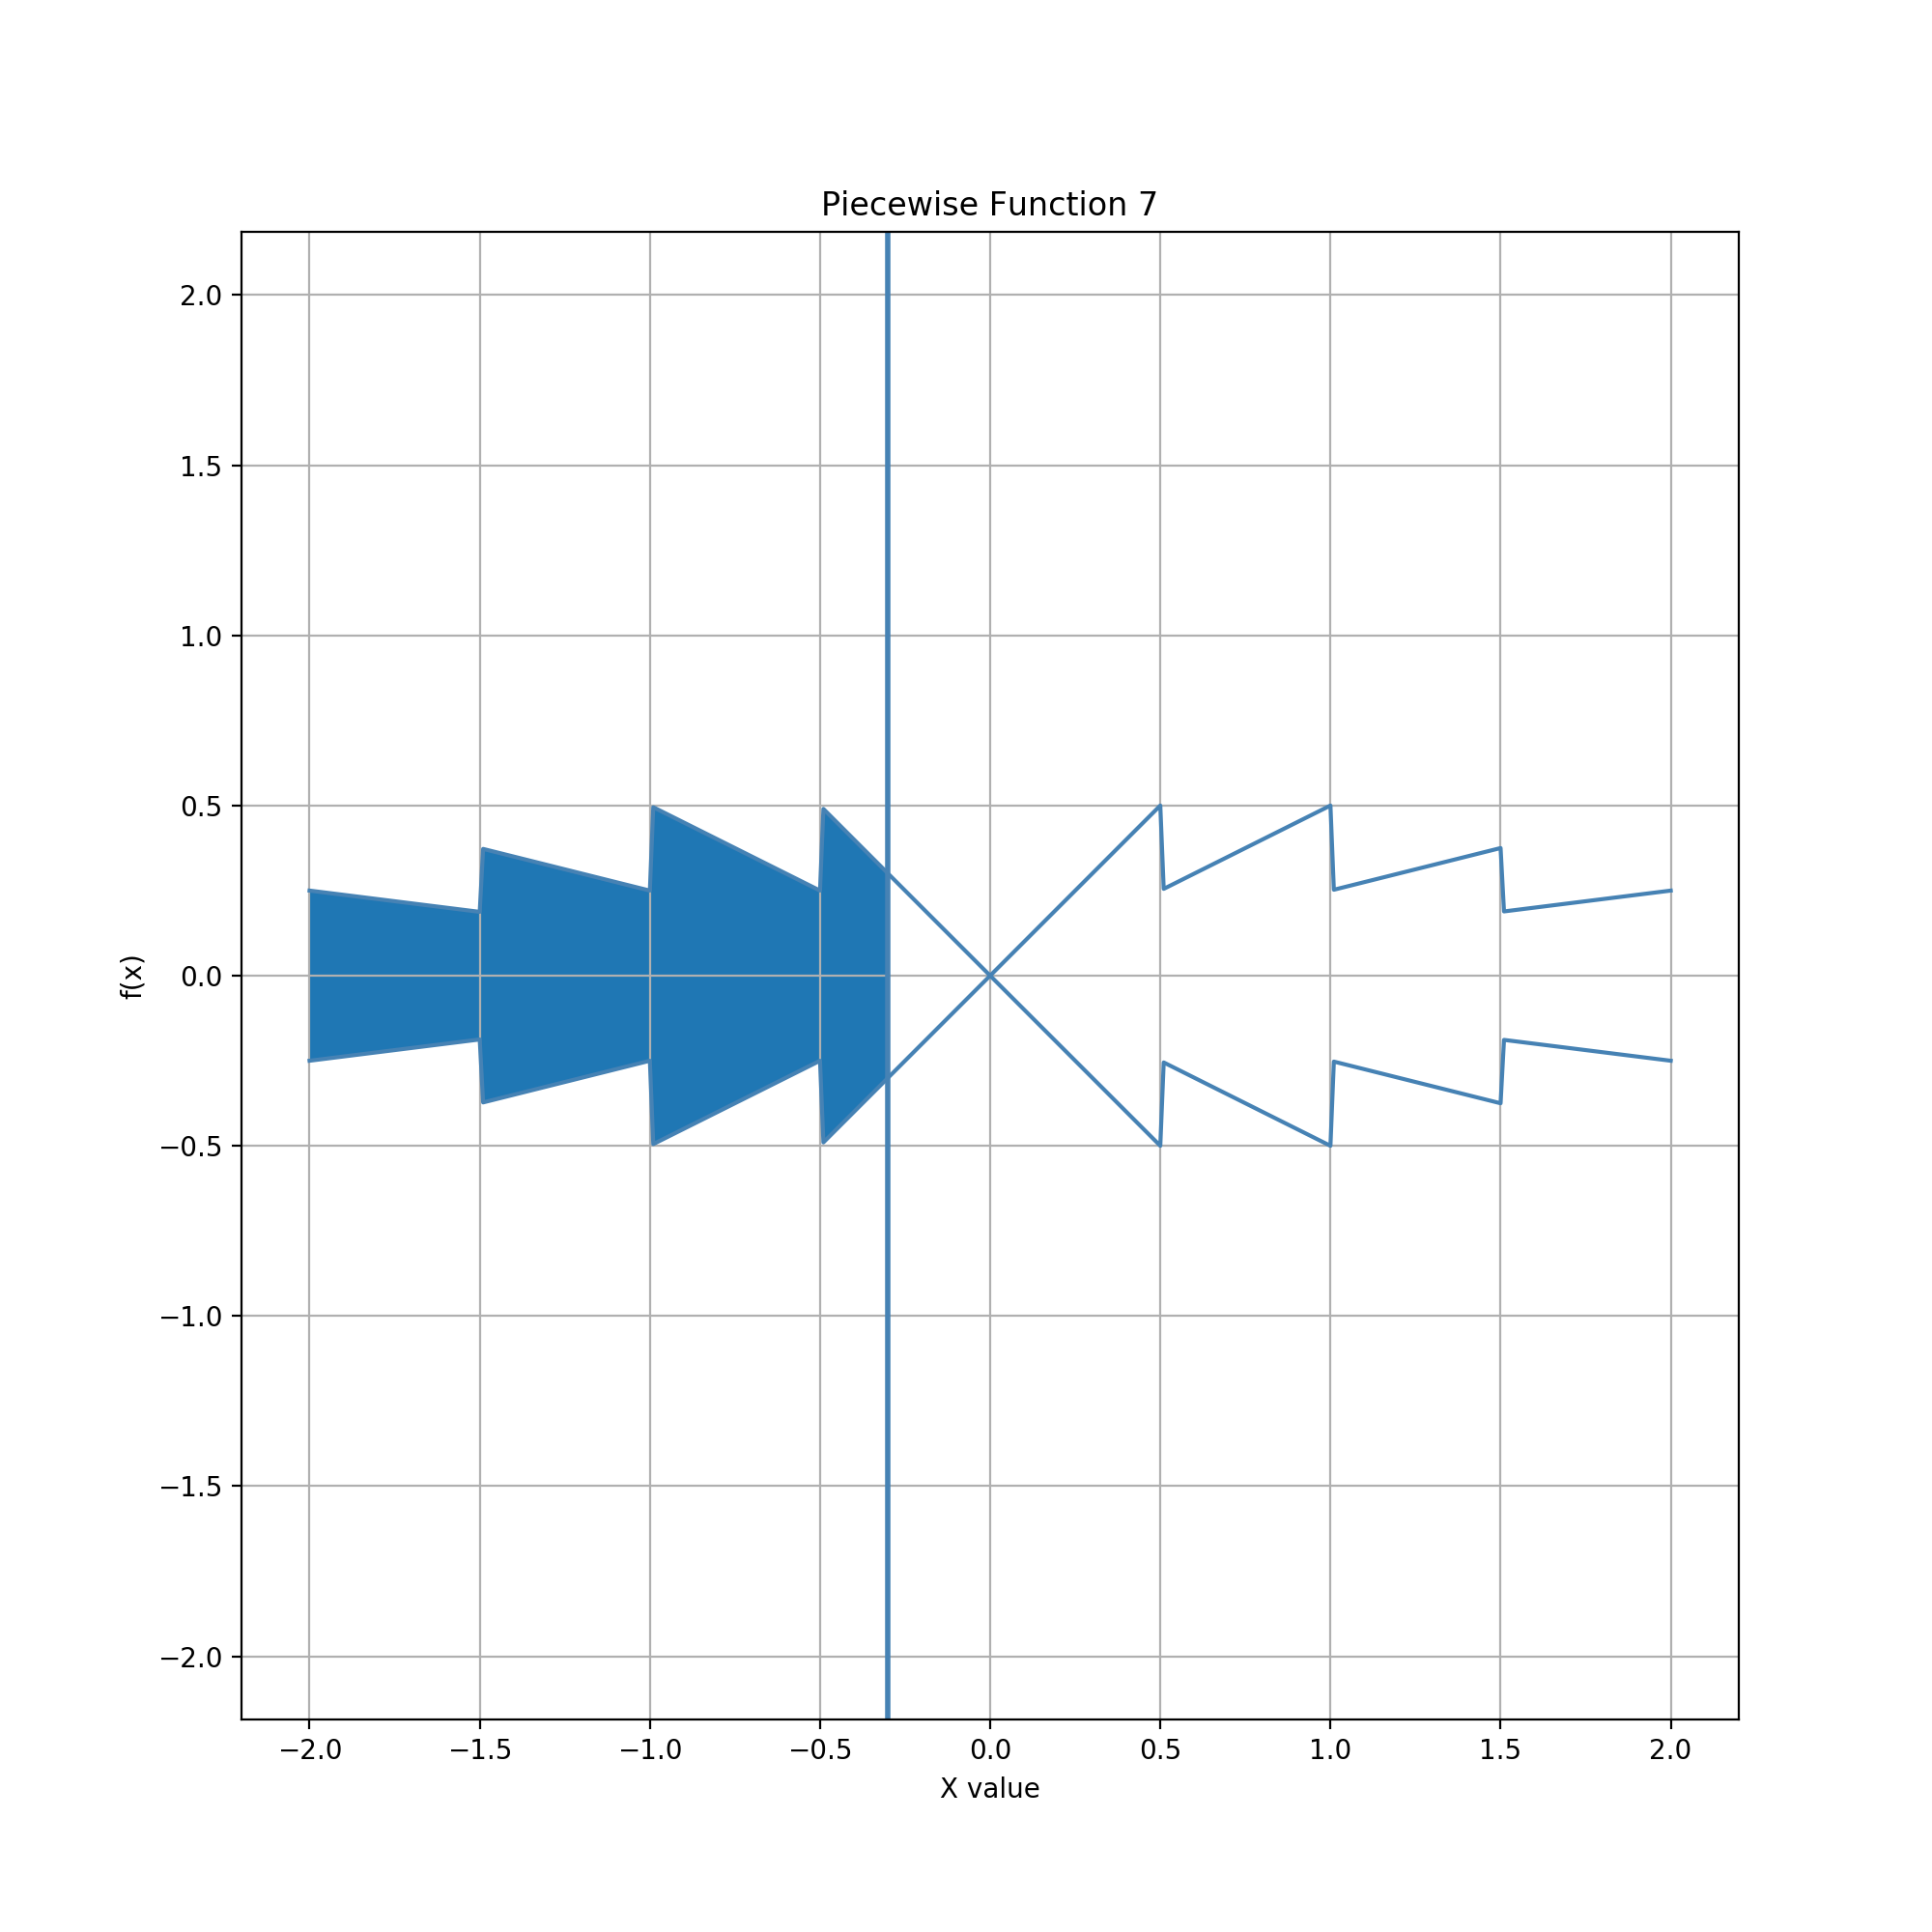
Glyph = Compound (Sequence of Diamonds), Guide = Vertical Line
In this example, the glyph is a horizontal sequence of multiple diamonds, in this case four of them. The gesture works exactly the same way as in the two diamonds example, but results in a data value distribution with multiple transitions between four subranges that allow faster adjustment and five subranges that allow more precise value setting.
In the more general case of N diamonds, there are N faster subranges and 2+(N-1) more precise subranges: 2 for the infinitely width subranges outside of the glyph, plus N-1 for the subranges near the shared vertex points of successive diamonds. A specific number of diamonds can be used to allow editing that focuses on an equally distributed set of likely values. For instance, one could use a nine-diamond sequence to edit numbers that can fall anywhere in the range [1.0, 10.0] but that tend to be close to exact integers, which may be a desirable constrained data type for ratings.
The above glyphs with sequences of 2, 4, and 9 diamonds are all examples of designing with identical copies of the same finite shape. Sequences can also involve heterogeneous shapes. For instance, designs can mix circles, asters, and diamonds (as well as other shapes with different height profiles) to customize how speed and precision varies in particular subranges. For instance, using asters instead of diamonds would allow for easier entry of data values near more precise "focal" values. Using circles would have the opposite effect.
Glyph = Compound (Widening Cones), Guide = Vertical Line

Glyph = Compound (Narrowing Cones), Guide = Vertical Line

Sequences can also mix in infinite shapes, like in the stretched diamonds example, to customize distribution profiles with infinite extent above or below. The individual glyphs in a sequence can also have differing characteristics. For instance, one can vary the width and/or height of several diamonds in a sequence, thereby shifting where and how tightly focal data values fall within the bounds of the distribution.
Multiple cones can be similarly stacked to fine-tune a distribution. The figures above show glyphs for a set of four widening cones and a set of four narrowing cones, respectively. The corresponding distribution graphs have the same overall shape but differ strongly in the details. Complex, ad hoc gestures like these are unlikely to find a use in practical, but demonstrate a capability to customize highly specialized glyphs for unique applications.
Glyph = Compound (Sculpted Mix), Guide = Vertical Line
In the most general case, glyph geometries can be sculpted using a collection of mixed geometries. In this example, for instance, horizontal and diagonal line segments are interleaved to customize the rates of accumulation in successive spans in the data value distribution. The flat segments result in a constant rate of increment both near zero and toward the extremes of the reachable range.
Looking forward, sequences might also include one or more flat segments of zero height. These segments serve as spacers to provide zones for entering exact data values. If a glyph is finite, the infinite spans beyond the upper and/or lower bounds can be thought of as infinite spacers. Regardless of where they occur, spacers allow easier exact entry by providing a non-zero width horizontal space in which height is zero, and hence no accumulation of area occurs while dragging the guide line. Consequently, one can quickly move the line anywhere along the spacer to choose the corresponding data value.
Spacers would provide an effective way to support editing of constrained data types that mix discrete and continuous values. In the ratings example above (sequence of diamonds), for instance, the goal might be to facilitate the common case of entering exact integer values, yet allow entry of decimal values in special cases. Adding spacers to the 9-diamond example would accomplish that. The width of the spacers relative to the diamonds could be set to determine how strongly favored (easily entered) integers are compared to decimals. The height of diamonds could be changed to increase or reduce available precision between integers. Other shapes could be used to change the distribution profile between successive integers. For instance, the diamonds could be replaced with squares to make decimal entry a linear function of dragging distance between the spacers.
A geometrie offers numerous geometric relationships to choose from in gesture design. Surveying the design space is helping us develop principles and guidelines for tailoring combinations of editing geometries to specific data types, and do so in ways that are compatible with visual encoding choices.
The examples above progress from the simple to the exotic. This approach serves our purpose of surveying the gesture design space. Moving forward, we will vary and relax the assumptions made in exploring the example sequence above. Potentially important variations to analyze include those in which the guide geometry has more than one interactive degree of freedom, such as to support rotation as well as translation of a guide line, free 2-D movement of a guide circle, or dynamic resizing of a guide circle. We will also explore how data can be edited as a function of geometric relationships other than area of intersection, specifically distance and direction.
It seems likely that focusing on relatively simply geometries will be sufficient to inform the bulk of practical gesture design. Although most data sets have data attributes with constrained types, those types are rarely exotic, and probably almost never have distributions as exotic as those in the more complex examples above. Gestures with simpler geometries also appear likely to be much more learnable, memorable, and performable than complex ones, particular when used as part of a data editing toolbox in a multiple view visualization design.
One of the practical challenges of gesture design will be reconciling the geometries used to visually encode data with those used in gestures to determine changes to that data. A geometry that works well for visual encoding may work poorly for gesture design, and vice versa. Common shapes like circles, diamonds, and asters are often appropriate and commonly used in visual encoding of data, but that very simplicity offers limited geometric structure for use in calculating interactive changes to data during editing. Conversely, complex geometries can facilitate gesture design for highly specialized data types, but may often be poorly suited for visually encoding data attributes in a readable, scannable way.
Visual encodings in which shape varies as a function of data are an especial challenge. In such cases one cannot rely on a uniform gesture geometry for data edits. One solution would be to require that gestures vary in parallel with the corresponding visual encodings; there can be multiple visual encodings and gestures in a view, but they must be geometrically compatible from data item to data item. Another solution would be to design gestures that occur within the view but are not geometrically related to individual data items. In the various examples above, the various glyph geometries would be associated with (and drawn as a part of) the entire view rather than individual data items. We revisit this issue in an analysis of practical gesture designs in our interactive Gesture Browser, next.