
Geometric Data Editing (2015–2017)
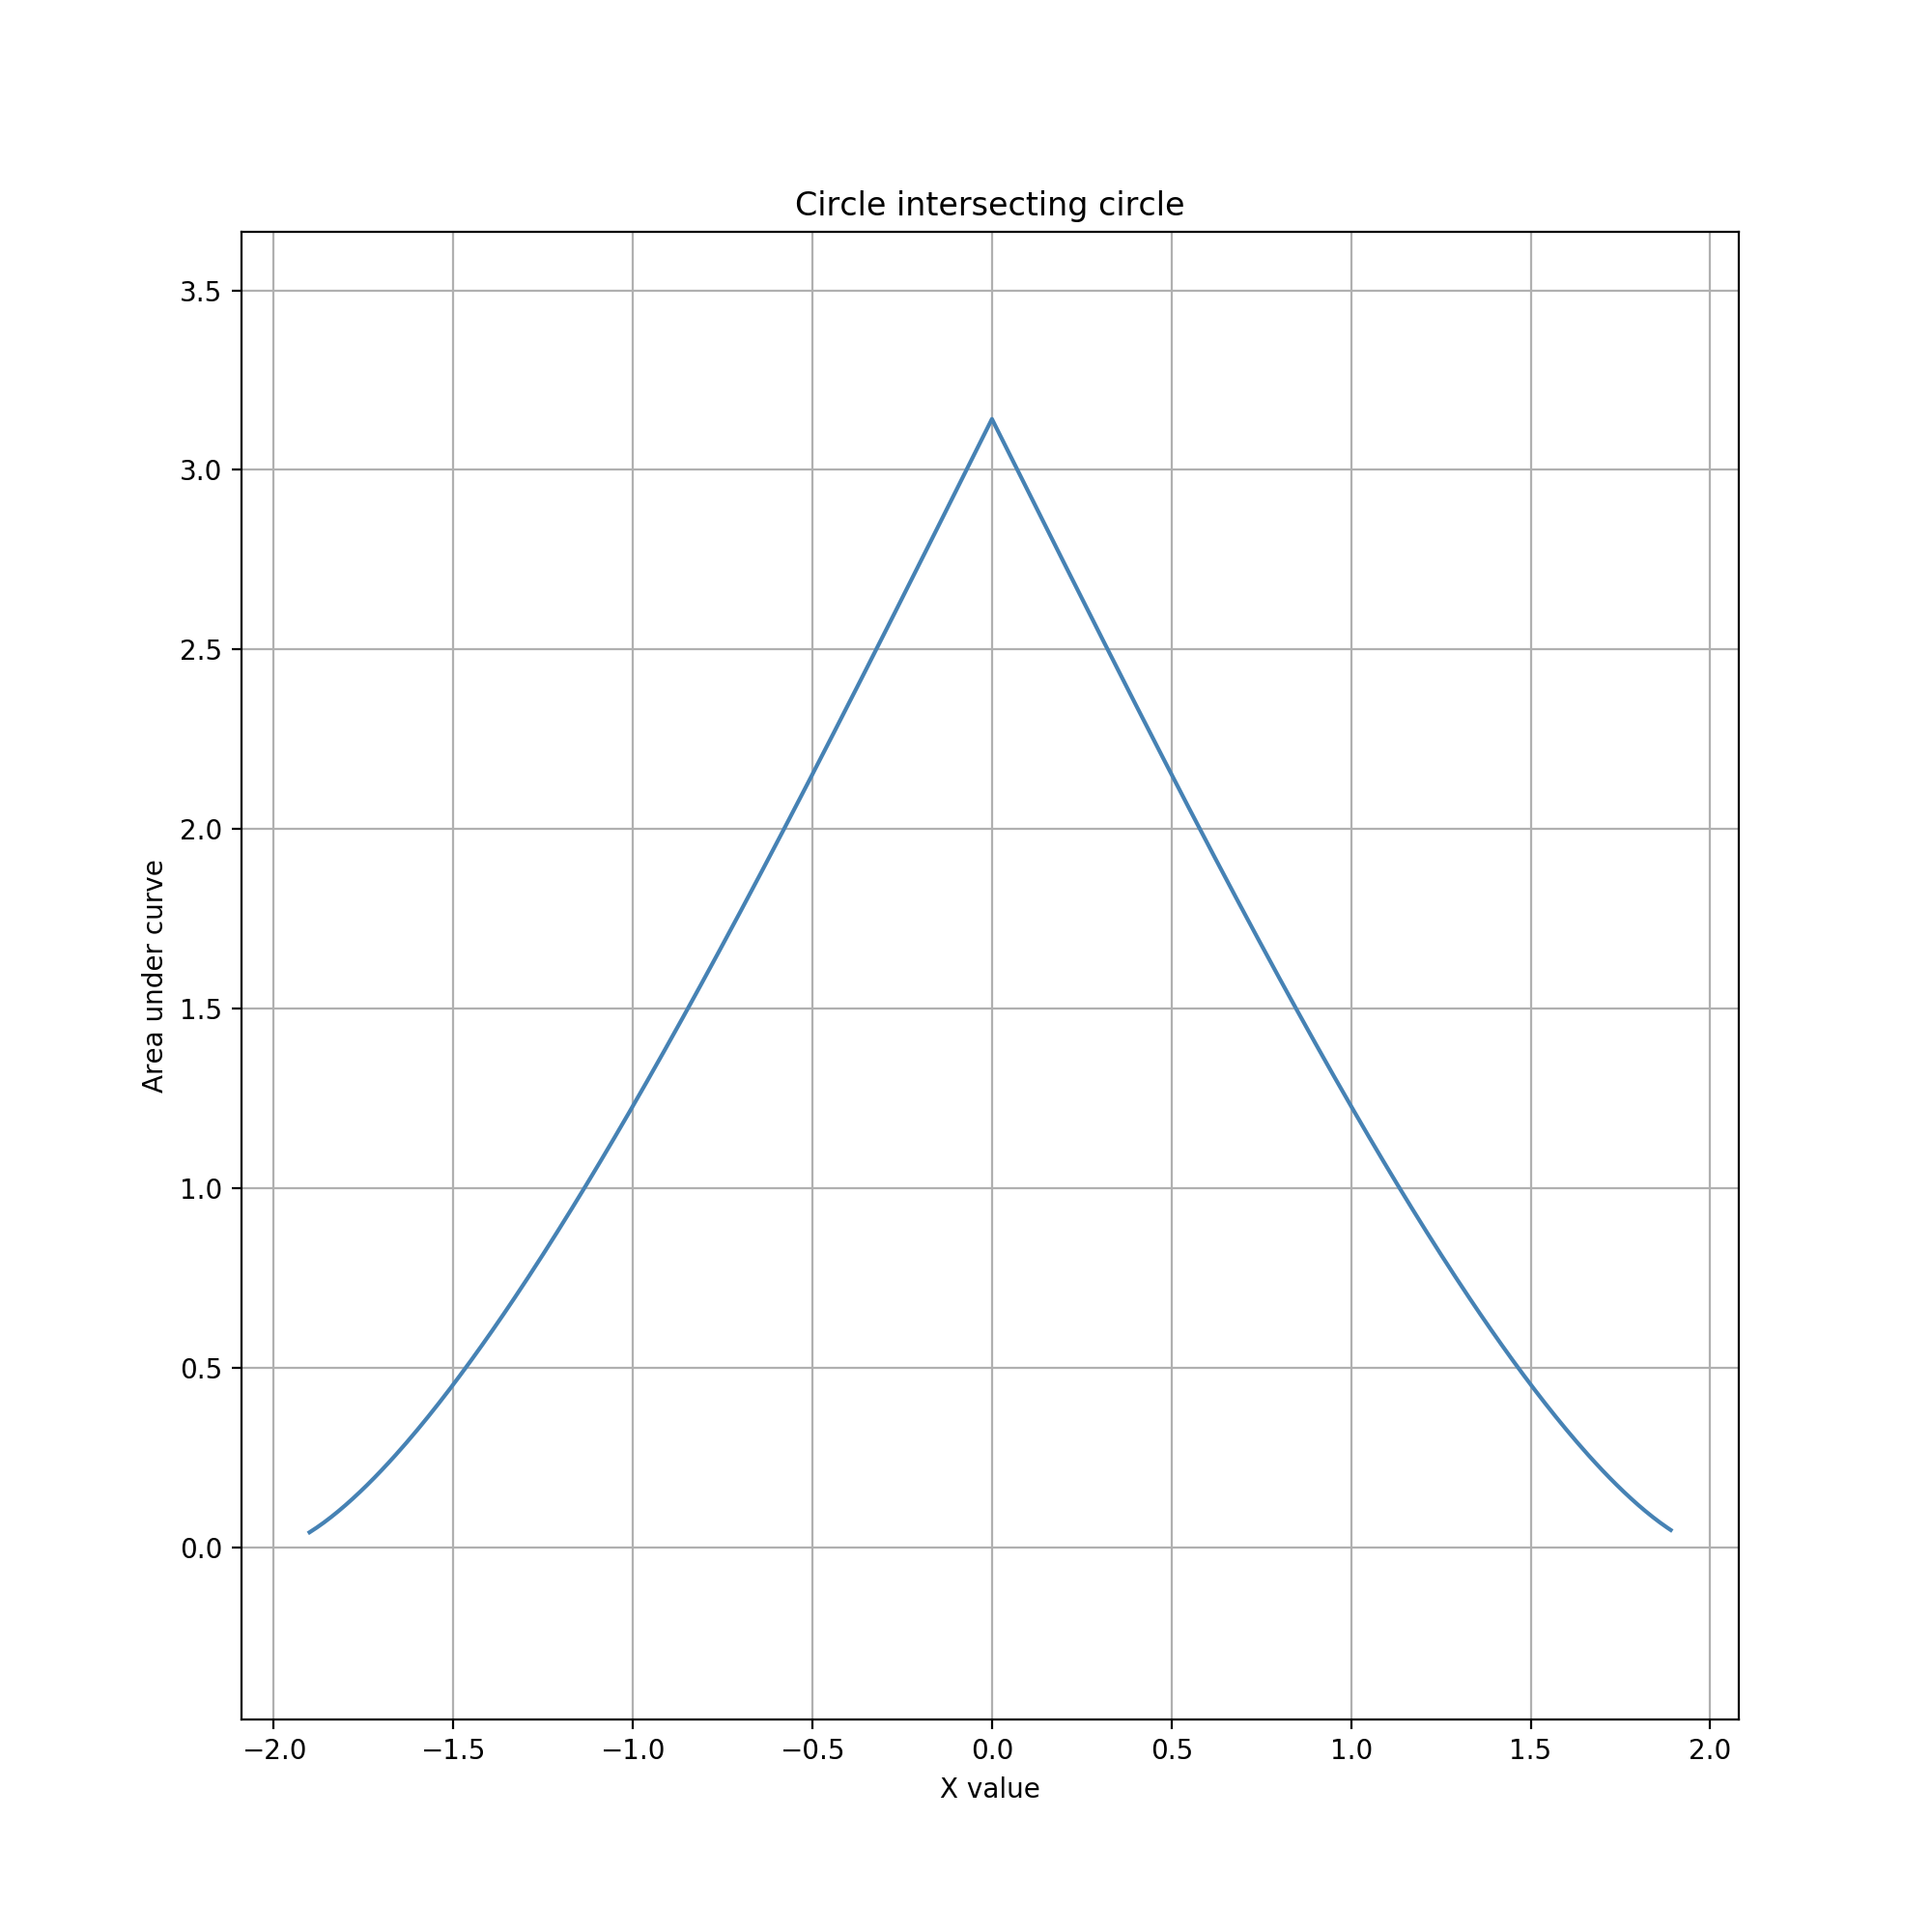
We adopt the term geometrie to refer to a prioritized collection of geometric objects and the relationships between them. The objects and relations in a geometrie can be used to compose geometries for several purposes: to visually encode the spatial characteristics of data items (glyphs), to similarly encode the spatial characteristics of gesture feedback (guides), and to define functions that relate item and feedback encodings. The geometric inputs to these functions can come from the data encoding, the gesture feedback, or both. Gestures evaluate those functions to produce data values, which are assigned to the attributes of targeted items in the visualized data set. Editing can happen continuously, in discrete stages, and/or at the end.
For example, data items might be visually encoded as circles with fill color indicating an importance value. Clicking any point in the view sets the importance value to be the distance from that point to the corresponding data item's center. Similarly, a horizontal line dragged vertically might set each importance value to be the minimum distance from the line to the corresponding center. These two gestures involve the same visual encoding of items (glyphs), but use different feedback encodings (guides), and apply different functions to map the relationship between glyph and guide geometries into new data values shown as fill color. Editing is discrete (clicking) in the first gesture and continuous (dragging) in the second — although the latter could be designed otherwise — in both cases causing fill color to adjust dynamically after each click or drag movement. The two gestures differ substantially in both appearance and behavior, despite serving essentially the same editing purpose. Such variety in designing gestures for edit data of a particular type can support either general-purpose use or application-specific needs.
Functions can be applied to the geometric objects in a geometrie to produce useful data values of a variety of different data types. Some functions produce decimal values in the form of scalar measurements on geometric objects, such as the length of a line segment or the area of a circle. Other functions apply some sort of decimation to geometric objects to produce integer values, such as the quadrant of a point in a circle. Other functions test for a geometric condition to produce boolean values, such as whether a line segment intersects a circle or a point is inside a polygon.
Using the geometrie, these functions can be effectively reduced to simple characteristics of composed geometric objects. Consider the two previous example gestures. In the first example, editing happens by taking the length of the line segment that connects the click and item center points, rather than calculating the distance between those two points. Similarly, in the second example, editing uses the length of the normal line segment that connects the item center point to the dragged line.
In most visualized data sets, data values are almost always booleans, integers, decimals, or strings. Geometric gestures appear flexible enough to support general editing of the first three types. On the other hand, interactive entry of strings falls outside of our geometric editing approach. Entering strings can still happen by conventional means, such as in a popup textbox. Gestures can still be used to select which data items take the entered string as a new attribute value. Moreover, if the set of allowed strings is small and fixed (categorically typed) rather than arbitrary (nominally typed), gestures for editing integers can be combined with an integer-to-string index. Each data item has a string attribute, the visual encoding displays that string as a label, the gesture produces an integer, and the edit consists of mapping that integer into a new string from the set. For example, if data items are visually encoded as circles labelled with the season, one could change the season to spring, summer, fall, or winter using a quadrant-picking gesture.
Geometric functions can also be used to design gestures for editing values of constrained data types. Real-world observations and measurements often fall into a limited set or range of sensible values. Data attributes and the gestures that edit them should respect these limits. The two example gestures above both use distance to allow entry of only non-negative decimal values, which makes sense for importance as a data attribute. The constraint in this case is a lower bound (of zero) on allowed decimal values.
Our goal is to support general-purpose visual data editing in a wide variety of real-world applications. Doing that calls for two efforts. First, we need to better understand the ways that a geometric approach to editing limits the reachability of data values, both theoretically (mathematically) and practically (on a real screen). Second, we need to better understand the ways that real-world observations and measurements can and should be constrained relative to computationally "raw" data types like integers and decimals.
The full scope of both efforts is beyond that of this project. Because we are targeting data editing gestures for digital humanities applications, within the scope of this project we are focusing on geometries that support addition and adjustment of small, bounded integers and decimals. Gestures for these constrained data types will allow editing of common kinds of information in digital humanities data sets, particularly counts, ratings, categories, geographic locations, and calendar date fields.
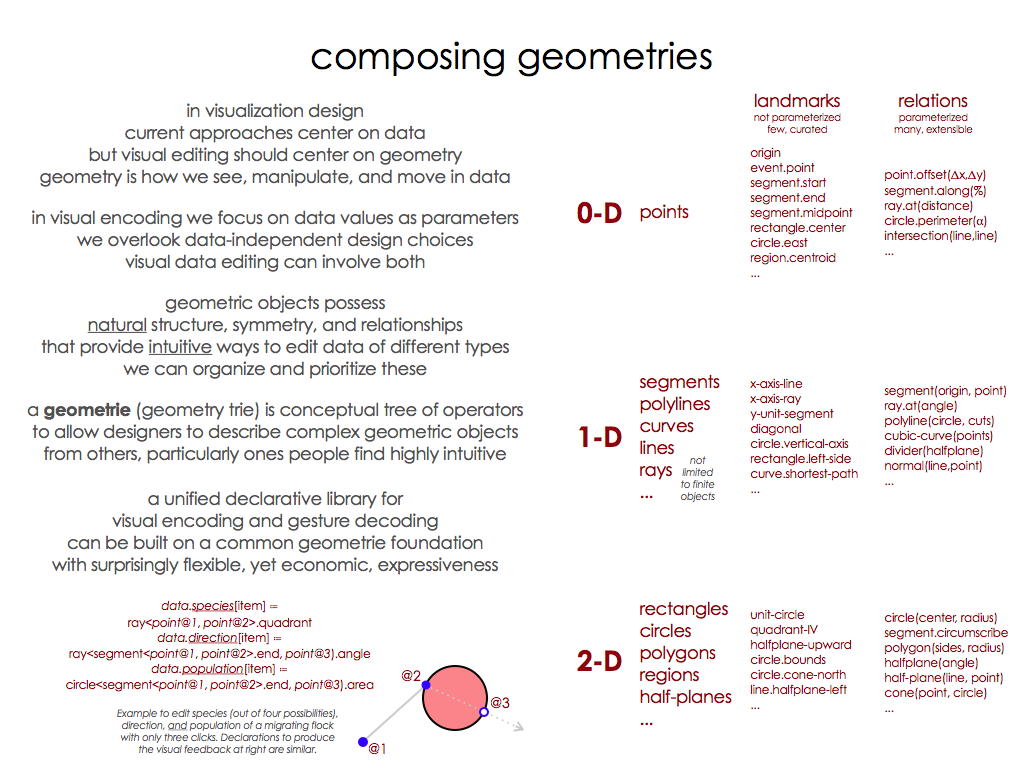
For example, imagine a visualization of ancient cities, displayed on a map as circles with area proportional to estimated population. The map provides a gesture to edit a conjectured fraction of non-native language speakers in each city's population. The gesture presents a circular guide. The edited data value is proportional to the area of overlap between the city circle and the guide circle. This gesture design has several benefits. It bounds edited values both above (to total city population) and below (to 0). It uses area as a perceptually accurate way to show fraction, including continuously during the gesture. It also allows more precise entry of very low fractions owing to the way circles overlap.
Glyph = Circle, Guide = Circle
This gesture involves two circles. The glyph circle is fixed in space. The guide circle can be moved interactively. The area of their overlap is used to define a data value. This geometric combination is radially symmetric; the overlap area is a function of the distance but not direction between centers. Consequently, it is enough to consider movement of the guide circle horizontally relative to the glyph circle.
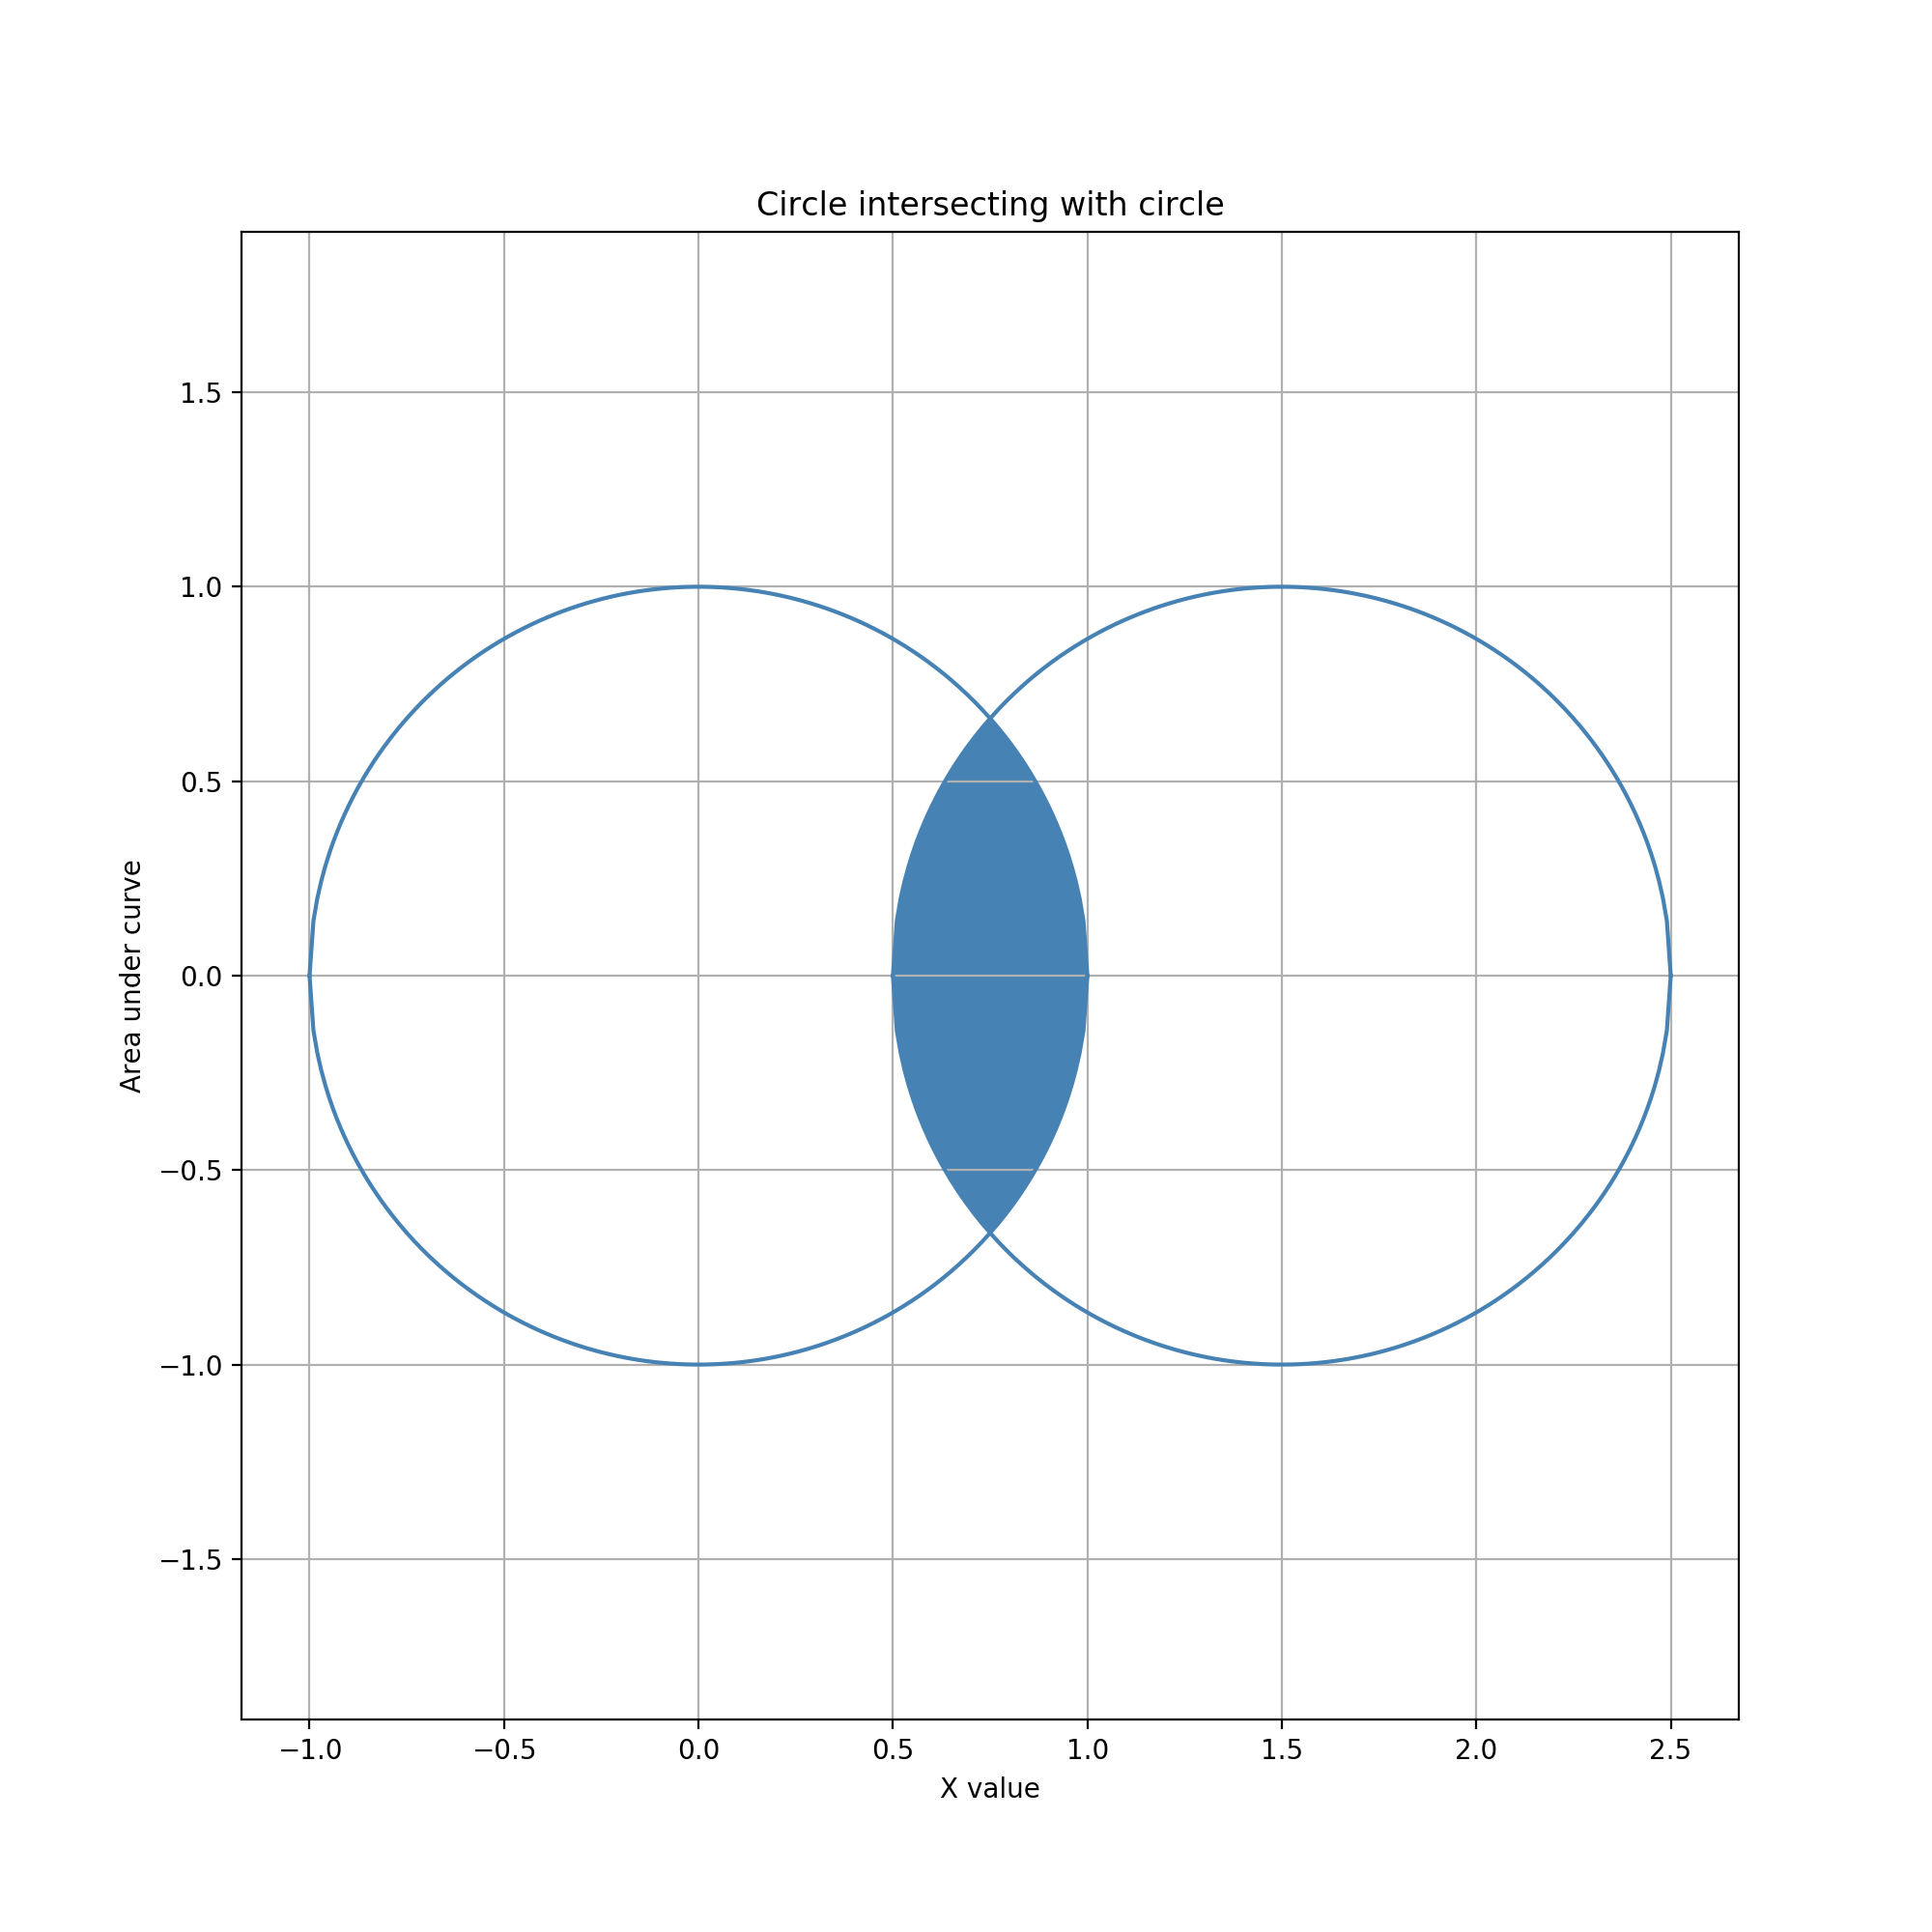
The data values that can be reached with this gesture range from 0 (no overlap, with the guide circle entirely to the left or right of the glyph circle) to the minimum area of the two circles (when they fully overlap or one fully contains the other). However, editing within this range is not uniformly sensitive to movement of the guide circle. As a function of horizontal movement distance, the area of overlap changes less when the circles overlap slightly than when they overlap a lot. Consequently, movements can adjust data values more precisely toward the low end of the reachable range. One can also quickly and easily set the data value to exactly zero by moving the entire guide circle anywhere to the left or right of the glyph circle. On the other hand, setting the data value to exactly the maximum requires slow, careful movement to achieve perfect overlap. This combination of advantages and disadvantages likely serves the above city example well, since editing in that application would usually involve small fractions.