
Gesture Browser (2017–2018)
The Gesture Browser is a cross-platform Java desktop application. On Mac and Linux/Unix systems, run it by double-clicking "gesture-browser" in the "bin" directory. On Windows systems, double-click "gesture-browser.bat". Your system must have a recent version of Java installed (1.8 or newer) for the application to work. Download the application here.

Upon launching, the application will show a single window. An interactive view of sample data is on the left. A gallery of available gestures is on the right. Selecting a gesture in the gallery activates that gesture for use in the view. A summary of how the gesture works is shown below the view.
Using Gestures
Gestures allow editing of visualized data in different ways. The idea is to perform a short sequence of simple, familiar interactions, in a particular order, to trigger the desired changes to data values. A key difference from existing data editing user interfaces is that one performs all the interaction directly on the visualized data itself.
The gestures included the gallery involve two interaction steps. The first step is to select items in the view for editing. The second step is to actually perform the editing by interacting with those items to adjust their data values.
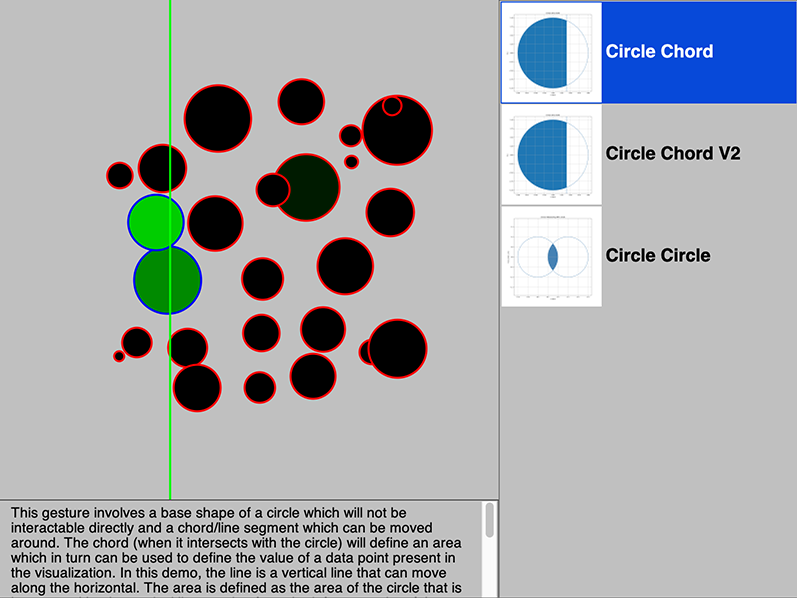
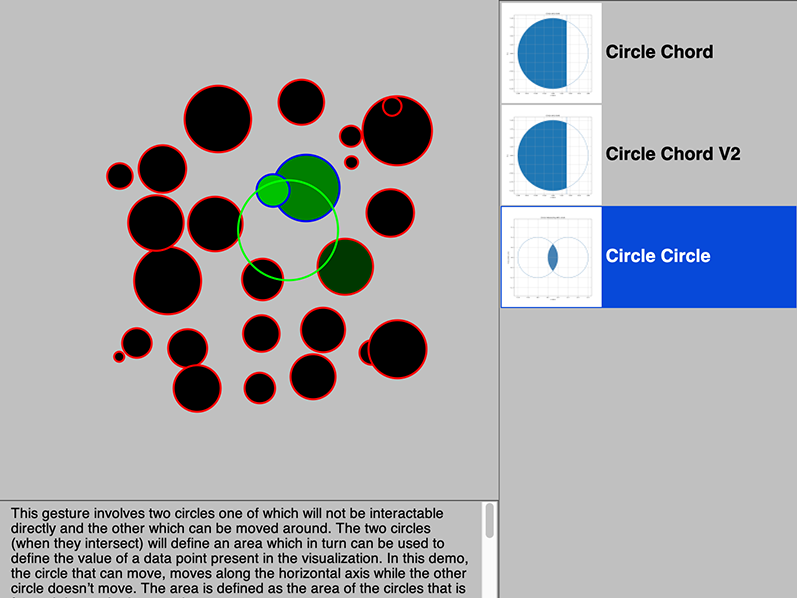
The view shows data items as circles of various sizes. To select items, move and click the mouse inside the view. Clicking will clear any existing selection and select all items that contain the click point. Selected and unselected items appear as circles with blue and red edges, respectively.
To edit items, hold down the <control> key and move the mouse around the view. As one does this, the view displays a visual guide. The appearance of the guide depends on the currently chosen gesture. How the data value of each selected item changes depends on the geometric relationship between the item and the guide. Release the <control> key to stop editing the selected items.
Trying Out Some Examples
During editing, the "Circle Chord" example displays a green vertical line as the guide. The horizontal position of the guide sets each selected item's data value to be the area within its circle to the left of the guide's vertical line. Each item's data value is shown as its circle's fill color. This color is calculated by mapping the data value into a black-to-green gradient. Editing happens continuously while <control> is down.
The "Circle Chord v2" example uses the same guide and maps areas into data values in the same way as "Circle Chord", but displays each item's data value as circle radius instead of fill color. During editing, each selected item is shown as both the original filled circle and a provisional unfilled circle. Actual modification of data values happens at the end of editing when the key is released.
In the "Circle Circle" example, the guide is a circle. For each selected item, the edited data value is the area of overlap between the item's circle and the guide circle. The data value is shown as fill color like in "Circle Chord". Editing happens continuously while <control> is down.
A Closer Look
The above gestures use slightly different combinations of line and circle geometries. The utility and usability consequences of these differences are striking, even for such a small, simple, seemingly similar set. Each combination holds promise for specialized editing, but there appear to be many tradeoffs when considering particular editing applications and circumstances of use.
In the "Circle Chord" case, the relationship between the guide line and item circles is such that moving from left to right accumulates circular area sigmoidally rather than linearly. This gives one more fine-grained control over data values near the minimum and maximum than might be achieved with a typical linearly-mapped range slider. (To recreate such a slider for the gallery, one could simplify the "Circle Chord" gesture using the relative horizontal position of the guide in the circle rather than the resulting area.) The gesture also provides sensible limits on edited values; one can choose the exact minimum and maximum values quickly and easily by moving the guide anywhere entirely left or right, respectively, of the selected circle.
In the "Circle Chord v2" case, the resulting data value can range from 0 (when the guide line is horizontally left of the circle) to the existing data value (when the line is horizontally centered on the circle) to twice the current data value (when the line is horizontally right of the circle). This allows one to "visually multiply" a data value in a way that makes sense physically and perceptually: one "moves" linearly (horizontally) to specify the multiplication factor and "looks" quadratically (chorded circle area) to evaluate the multiplication result.
Limiting the maximum applied multiplication factor, in this case 2x, allows one to quickly apply a desirable, precise multiplication factor to an existing data value. Similarly, discretizing the allowed movement of guide geometry would allow editing involving ranges of integers and choices within sets. For the gallery, one such gesture could step the guide by even fractions (x1/2, x1/3, etc.) and multiples (x2, x3, etc.) based on non-linear distance left and right of selected circle centers.
Large multiplications might be performed by chaining small edit movements rather than requiring one large edit movement. Chained editing can make is possible to keep guides visible and usable even when screen space or other design considerations compel use of small views. One can start to imagine a direct manipulation "gesture calculator" for data values. A suite of gestures could support arithmetic operators and beyond, including generally useful convenience functions (such as a 10x multiplier) or application-specific functions.
In the "Circle Circle" case, the way that circles overlap provides skewed sensitivity during editing, with very fine-grained editing of data values near zero and increasingly course-grained editing of data values as they increase to a maximum (at maximum overlap). A key idea here is that combinations of geometries can be designed to achieve a disired distribution of editing sensitivity. This is useful in applications in which the likelihood of recorded observations is not uniform. As a complication in this case, the edited value is normalized to a range relative to the size of the selected circles, which means that sensitivity increases with item size. Consequently, one is likely to be much faster and more accurate when editing large data values. This may or may not be beneficial depending on the application.
The three gestures differ in apparant usability when more than one item is selected. In each example, the sample data shown in the view provide some opportunities to select multiple items with a single click. When multiple items are selected, the guide and its geometry can have a different relationship to each item's geometry. For instance, the vertical line guide in the "Circle Chord" case might be in the middle of one selected item circle and entirely to the right of another. Although each item correctly shows its own corresponding data edit as the gestures proceeds, a problem arises with user attention. The user's ability to execute and evaluate data edits appears to require focusing on an individual item's change, at least when items visually respond to gesturing very differently. For instance, intentionally editing multiple items in the "Circle Chord v2" case seems much harder than in the "Circle Circle" case. We suspect that, for many editing gestures, the individuality of geometric relationships between multiple visually encoded data items and a single, unified visual guide in the same coordinate system is a fundamental barrier to editing items in groups.
One solution could be to allow gesturing in a view, but ignore its location relative to data. This solution is unsatisfying because it turns the gesture into a coincidental overlay that could have been performed anywhere else. Another solution would be to design guides that include a visual component for each selected item. Gesture movement within the view would still be disjoint from the visualized coordinate system, but the guide components would each have a sensible geometry and location relative to its corresponding data item. For more than a few selected items, overplotting problems appear likely both within the guide itself and between it and the data. Visual density effects are likely an important to consider during design even for singleton guides, especially for already dense and/or overplotted data representation.
Looking forward, one can imagine gesture design that allows not only the positioning of guides, but also changes to the internal geometry of the guides in response to interaction. For example, the radius of the guide circle is fixed in the "Circle Circle" gesture. A simple variation of the design would allow one to change the guide circle radius dynamically using the scroll wheel. This additional factor adds enormous complexity to the analysis of reachable data values. Allowing user adjustment of guide circle radius would affect scale, bounds, discreteness, and non-linearity during editing, particularly for very large or small ratios of guide circle size to item circle size. We predict that in many cases, dynamic changes to guide geometry will be too difficult for users to interpret and hence use effectively. For now we are focusing on simple guides with static internal geometries to grow our understanding of gesture dynamics.
The first version of the gallery focuses on gestures that follow a two-step select-then-adjust sequence. It includes several of the simpler geometric combinations that we've explored so far. The more exotic geometries that we've considered are unlikely candidates for use as visualization glyphs in practice. Despite including only a few simple geometry combinations in our analysis so far, the gesture design space has turned out to be a vastly more complex, interesting, and promising to explore than we anticipated. The visual representation of data items and guides, particularly their geometries, strongly affects which data values can be reached and how. Geometric arithmetic on the visual encodings of items and guides can be used to flexibly integrate scale, bounds, discreteness, and non-linearity into customized gestures with an eye toward both general-purpose and application-specific data editing requirements.