
Museum Collection Example and Educational Exercise (2018–2019)
We developed a full-featured visualization tool to demonstrate the in situ data editing and annotation capabilities being developed in this project. Motivated by the kinds of mixed-type data common in digital humanities, we designed the visualization for browsing and editing the metadata of physical objects in a museum collection, specifically artifacts in the University of Pennsylvania Museum of Archaeology and Anthropology. We gathered and collated 30 metadata attributes for 21 widely varying artifacts in the collection. The metadata attributes describe a wide variety of organizational, geographical, temporal, material, physical, and contextual dimensions of information about the artifacts. A photograph of each object is also included in the data. The user interface of the visualization user is shown below.
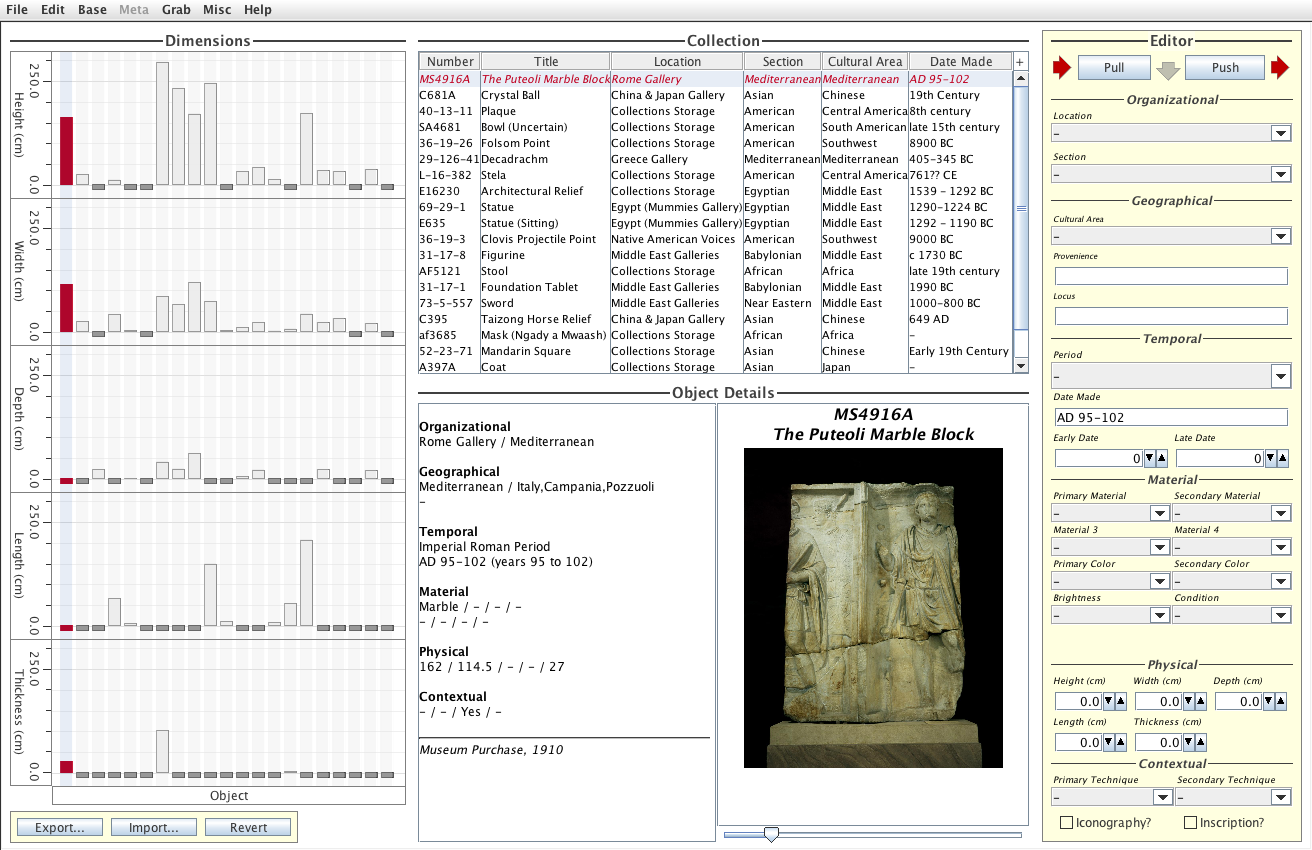
The user interface consists of two parts: the visualization proper (white background), and the annotation interface (pale yellow background). The main visualization consists of a variety of common, simple data views, including an overview table, bar plots, an image viewer, and a detail view that summarizes item details in a format inspired by online collection catalogs. The visualization supports two common kinds of interactive coordination between views. First, brushing interactions link the overview table and the bar plots; selecting an item in any of these view highlights that item in all of them. Second, drill-down interactions link those views with the image viewer and detail view, which show the photograph and metadata details for the currently selected artifact.
The annotation interface consists of common user interface elements for editing the various data attributes of the visualized collection. The choice of each UI element was matched to the type of the coresponding data element. In addition, the user interface elements are customized to allow the choice of either a default data value of no data value at all. This allows visualization users to record the lack of an observation about specific artifact characteristics, such as when the characteristic is unknown or uncertain by observing the item (in this case, from an artifact's image). Editing happens for one artifact at a time, with buttons to revert to previous values or apply any edits made. There are also buttons to export and import the full data sets to a file, allowing users to enhance the data set (starting from the original, limited one provided) over the course of multiple sessions.
Interestingly, the metadata in the online collection is relatively sparse, with many metadata fields lacking any recorded observation. This is a common occurrence in collections data. Resources for observing, gathering, and curating extensive details about collection items are often limited. Using visualization to facilitate these activities is a major motivation for this project. The museum collection data set provides an opportunity to demonstrate practical creation as well as modification of data that is both incomplete and uncertain due to the interpretative choices behind the observations that the data does contain. This evolving, uncertain, often subjective character of data is common in humanities learning and scholarship. We considered many possible data sets for the demo, and selected the museum collection data to demonstrate in situ visual data editing specifically because is it exemplary in this regard.
With collaborator June Abbas in the School of Library and Information Science (LIS), we developed an exercise to help students learn about both the basics of visualization as well as the new interactive data annotation features being developed in this project. This assignment was a part of the Data Stewardship and Visualization module in the LIS 5043 course Organization of Information and Knowledge Resources offered at OU in Spring 2018. In the exercise, the students first followed a tutorial about the layout and capabilities of the museum collection visualization tool. Second, they performed a set of 10 tasks to observe artifact details in the visualization then perform data editing in the annotation interface. Five of the tasks were prescribed, with known correct responses. The other five tasks involved free interpretation, allowing a wide variety of editing choices based on what they observed. Finally, they reflected on their experiences with the tool and the tasks. (Note that in this case, the exercise was strictly educational in purpose. We plan to follow a similar approach in upcoming studies of in situ visual data editing features as a part of the project's research plan.)
Try it out! The Museum Collection Demo is an Improvise visualization. Improvise itself runs as a self-contained, cross-platform Java desktop application. Download the visualization here. Note that your system must have a recent version of Java installed (1.8 or newer) for the application to work. You can also download just the PDF of the instructions/tutorial/tasks here.