InfoVis Interaction Survey (2014–2015)
We conducted a comprehensive survey of visualization interactions in the 570 papers published at the IEEE Conference on Information Visualization from 1995 to 2014. Our approach involves accumulating full bibliographic metadata on the papers, scanning each paper for candidate interactions, performing close reading to record and interpret authors’ explicit and implicit descriptions of interactions in their technique/tool/system, then recording details about each interaction into a database. This process has so far resulted in 486 identified interactions in the visualizations presented in 175 different papers.
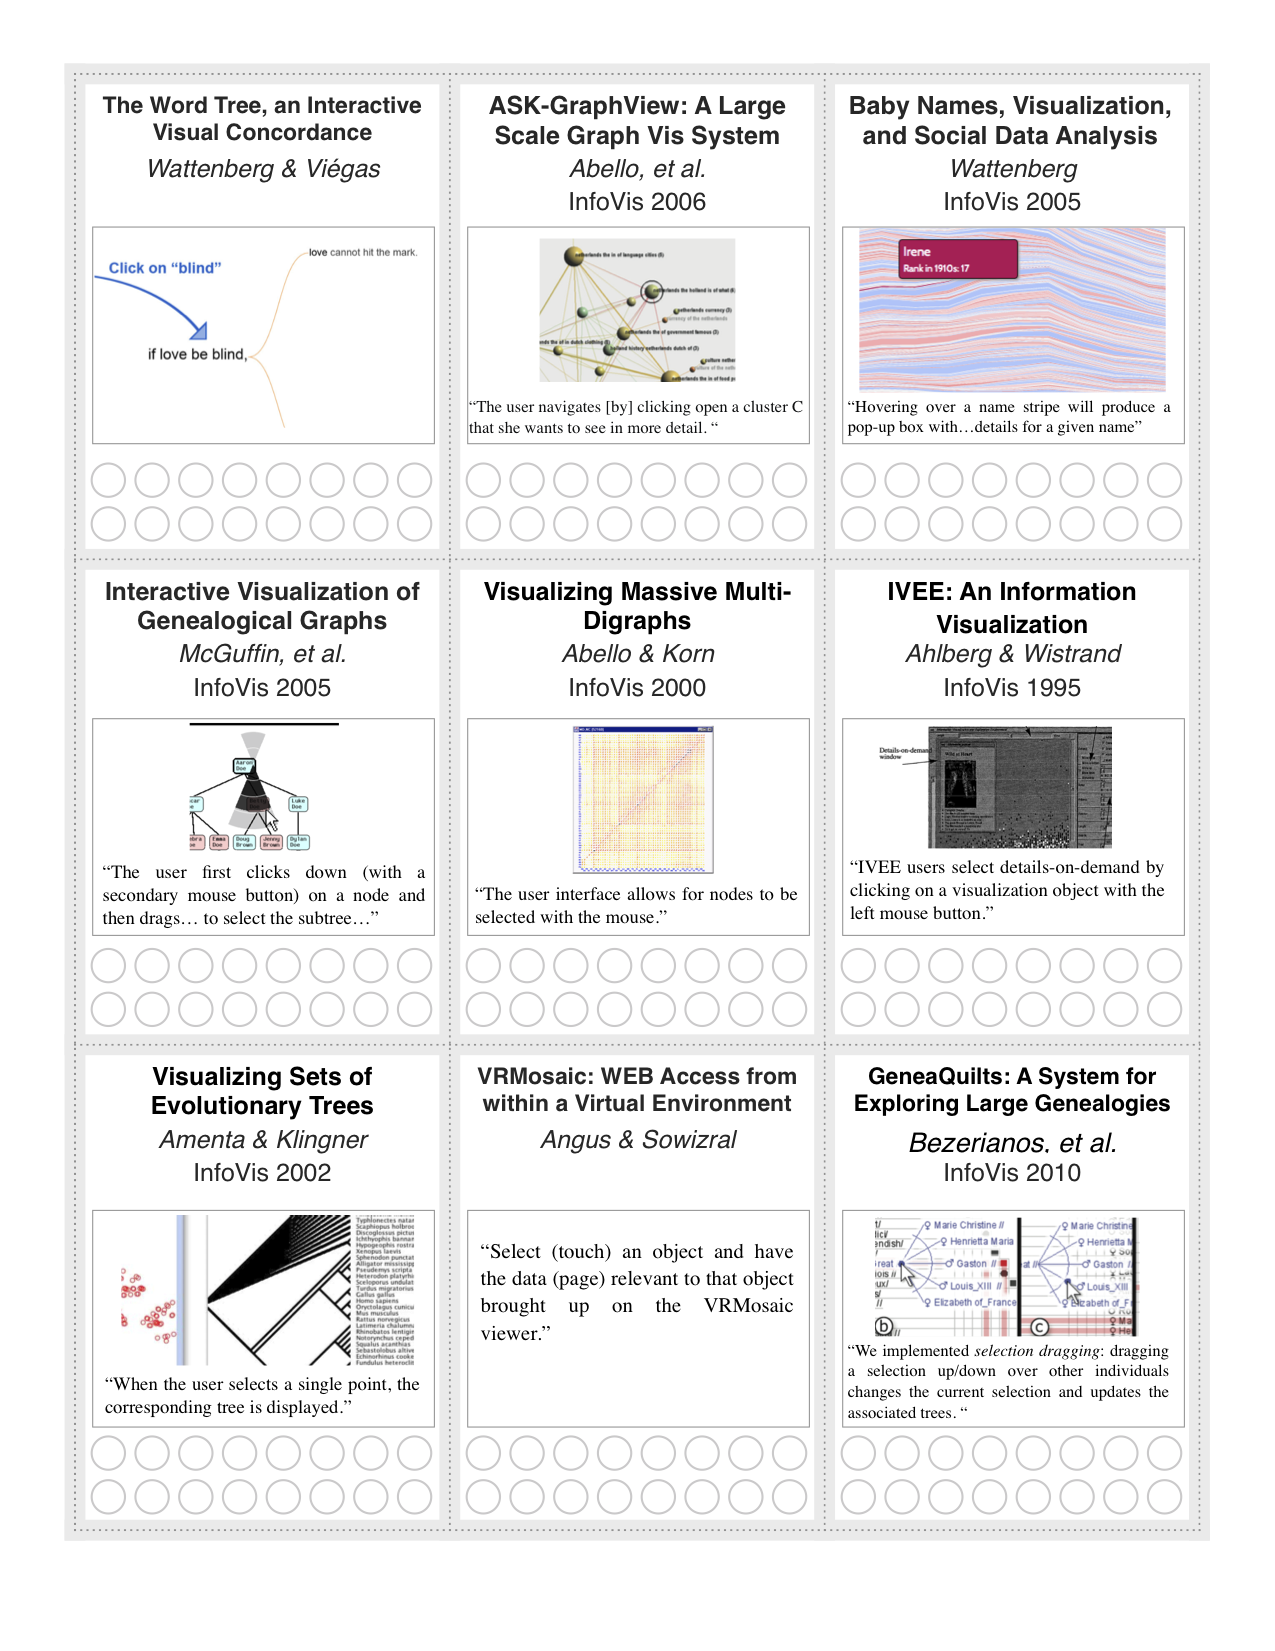
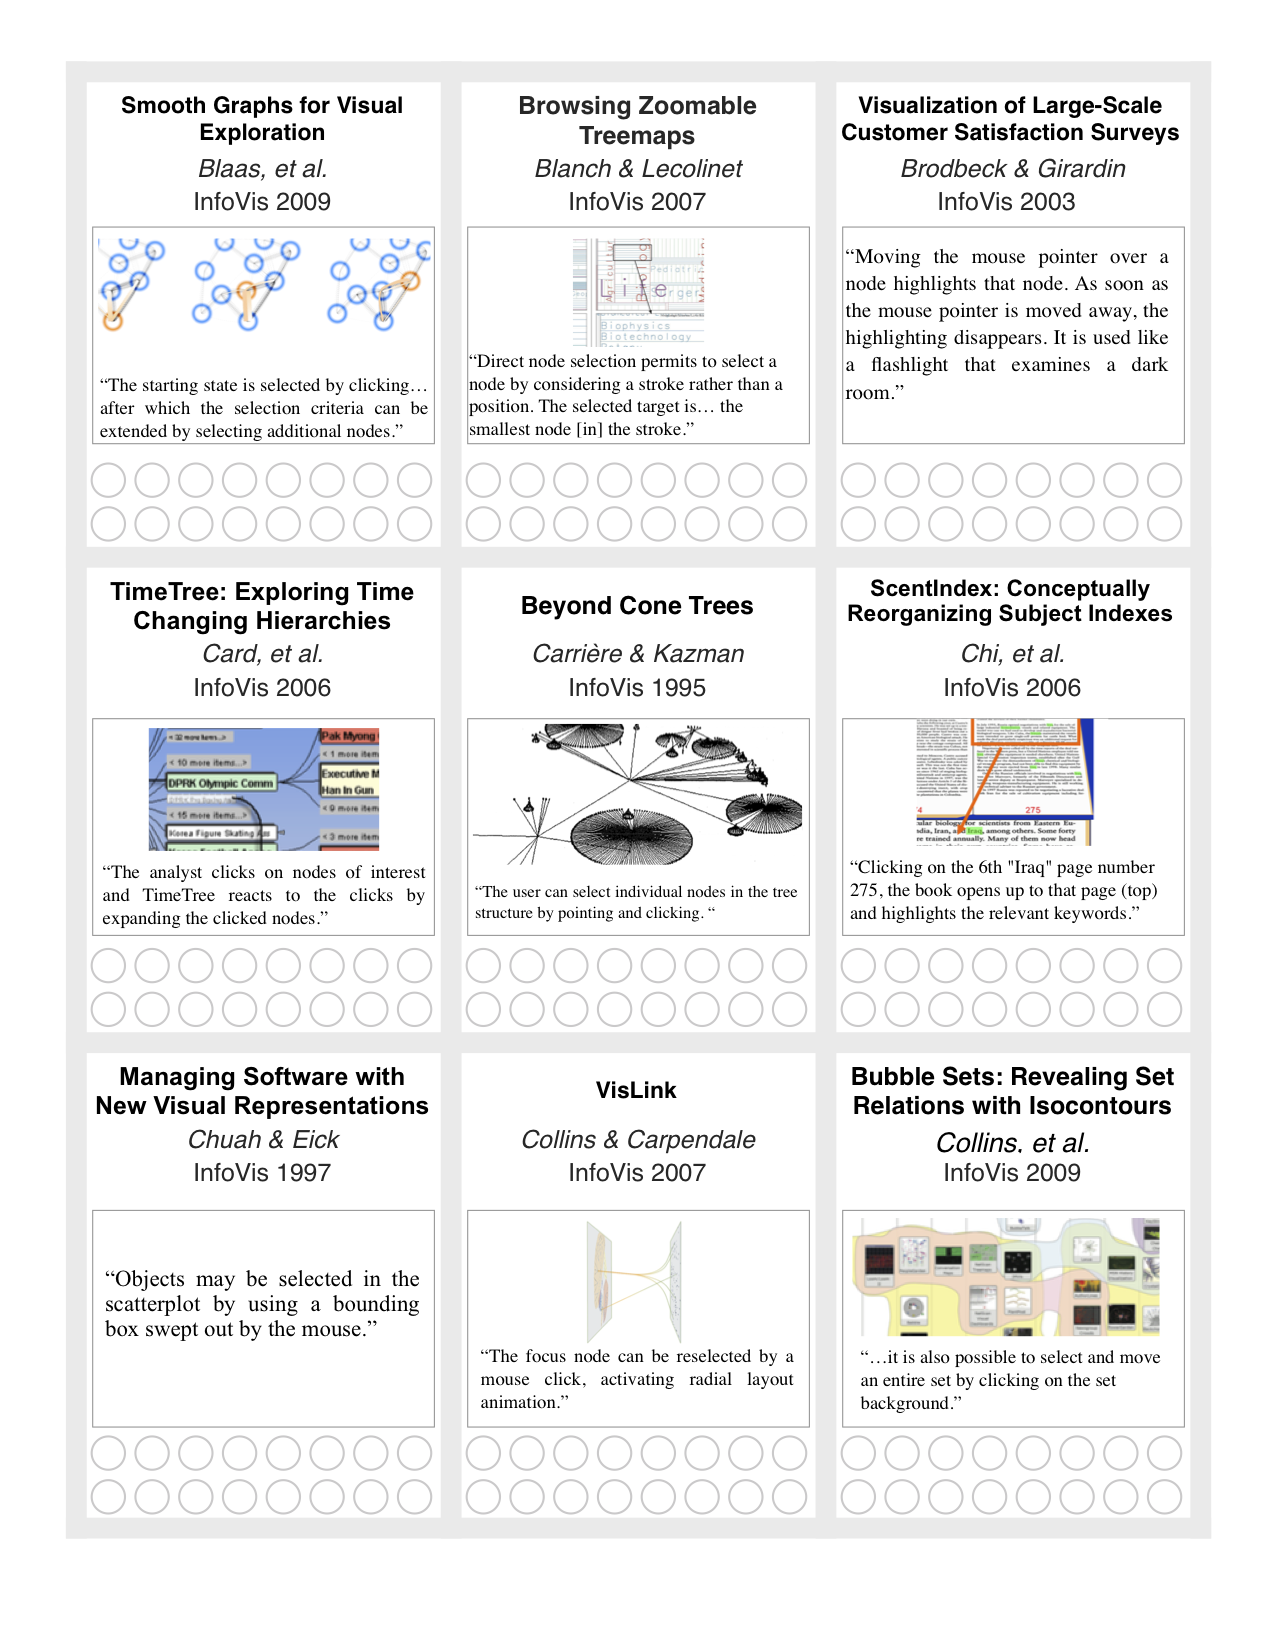
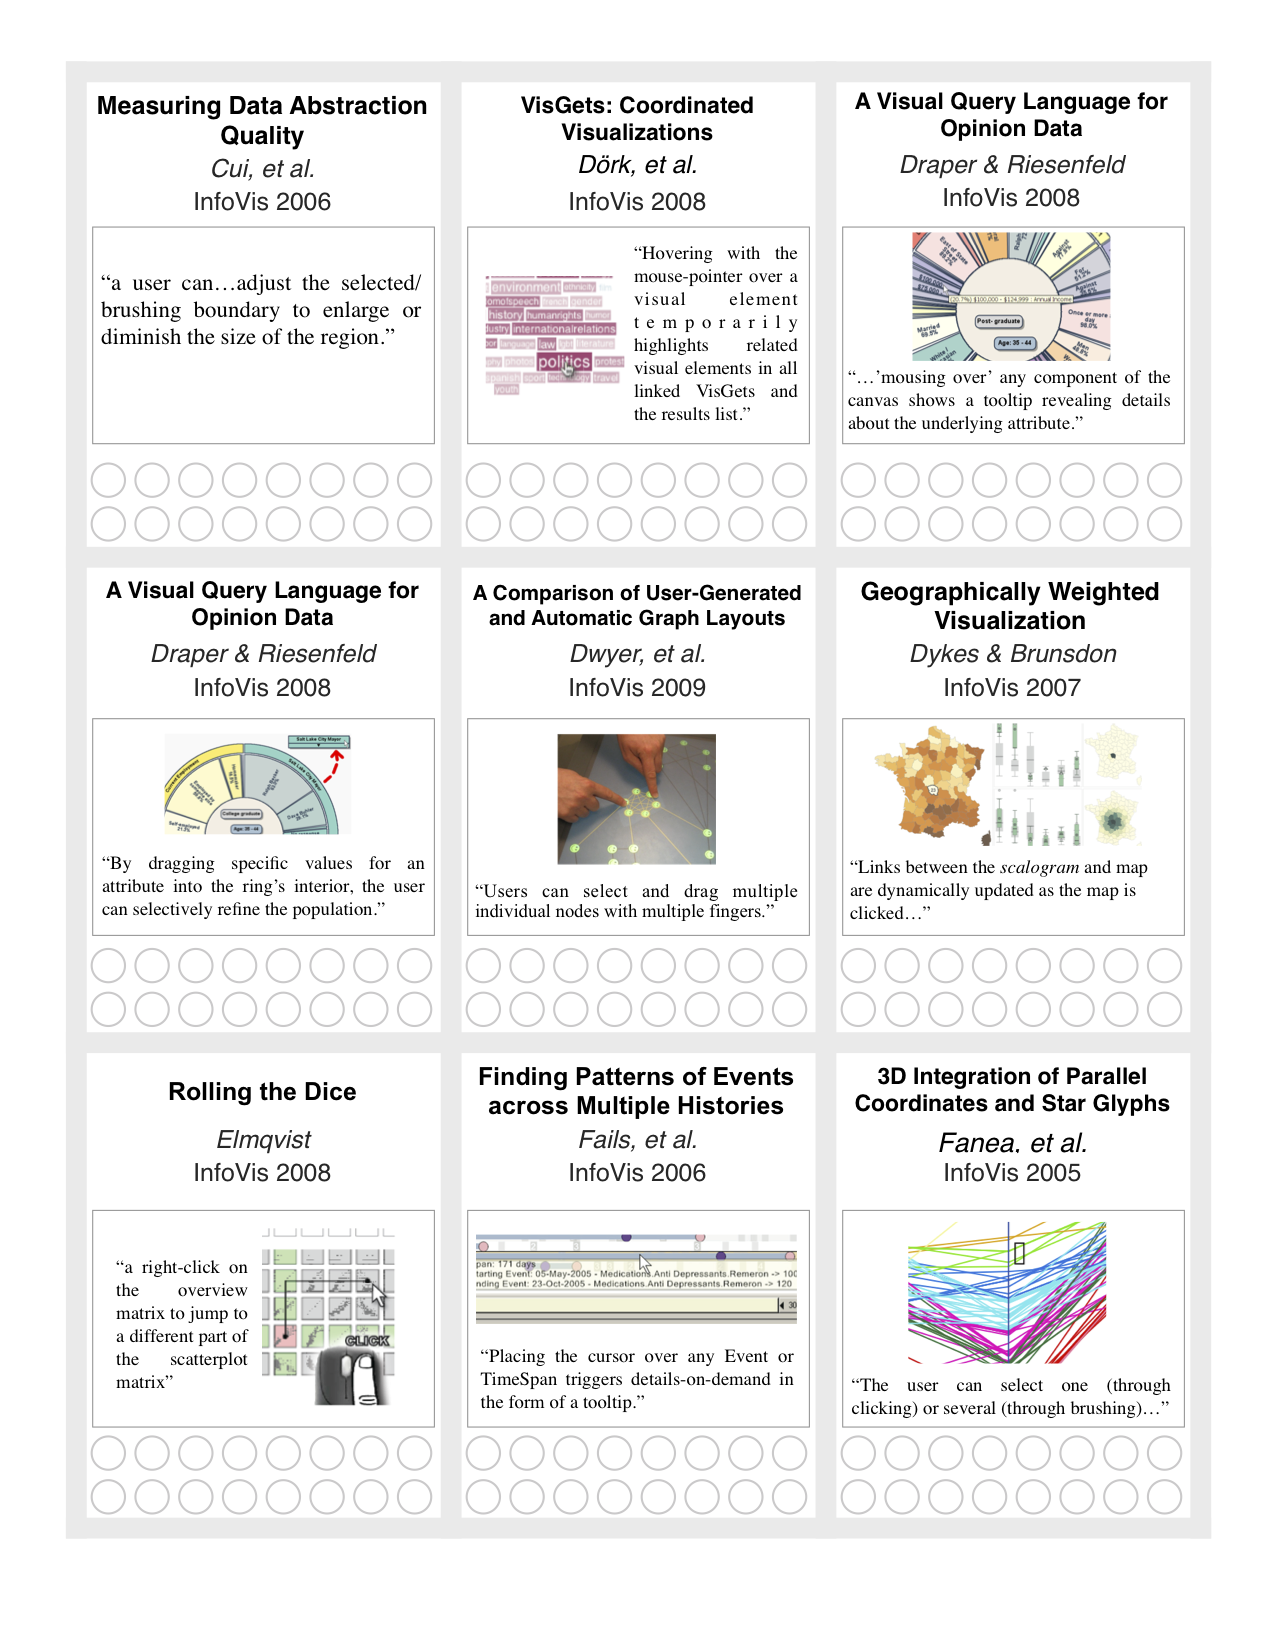
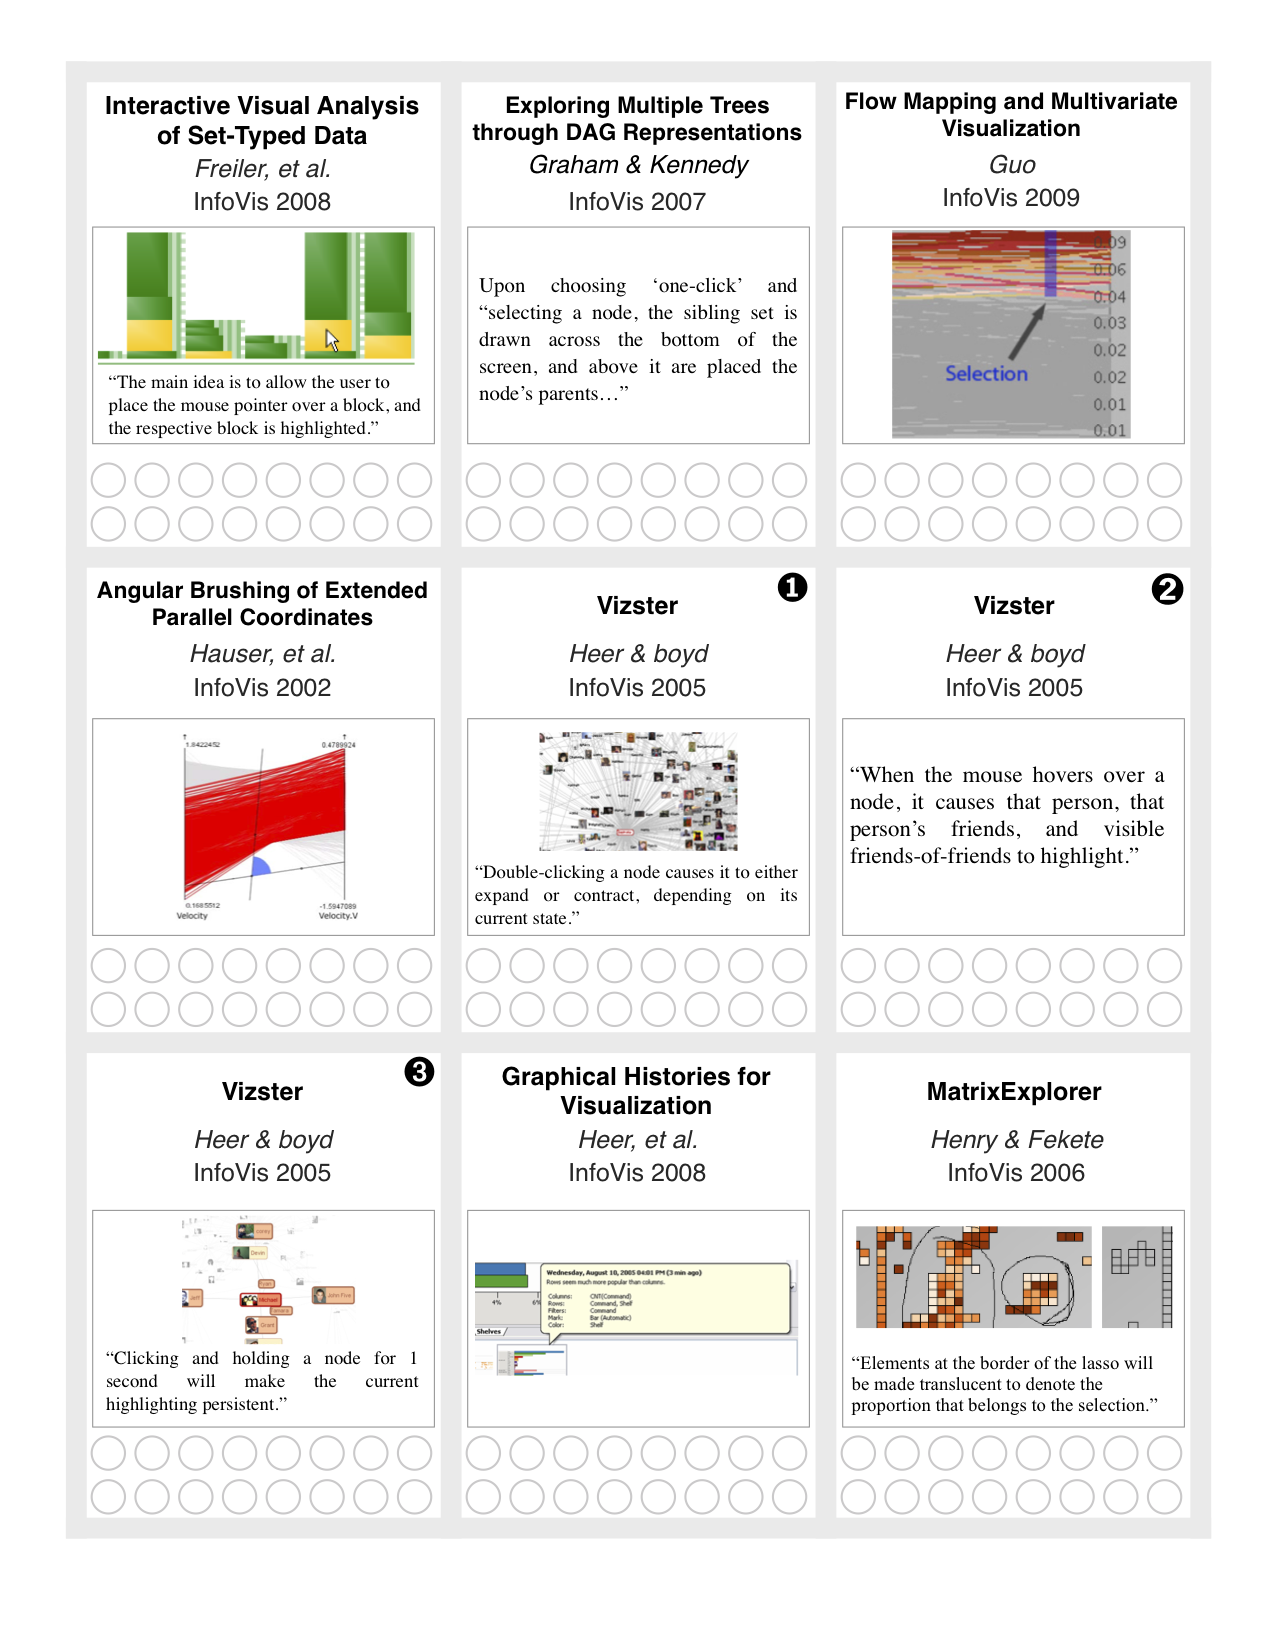
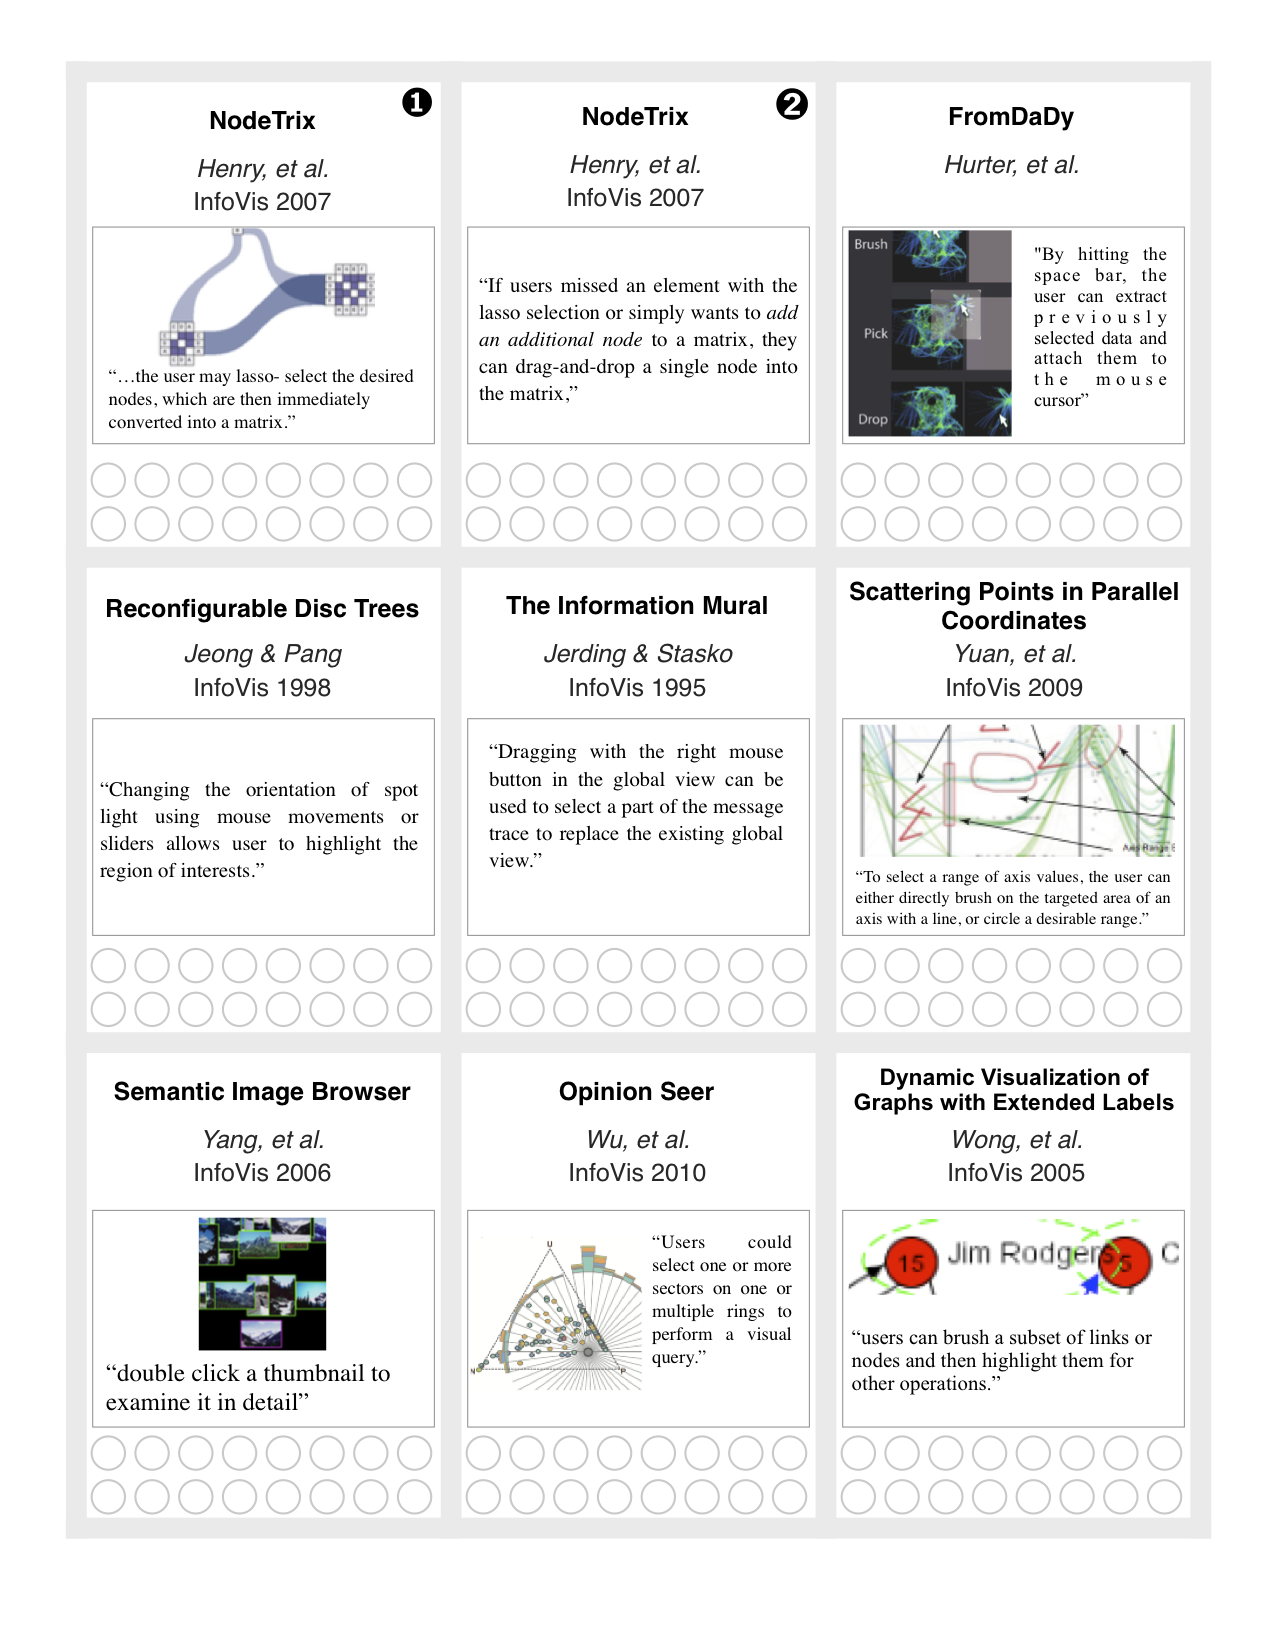
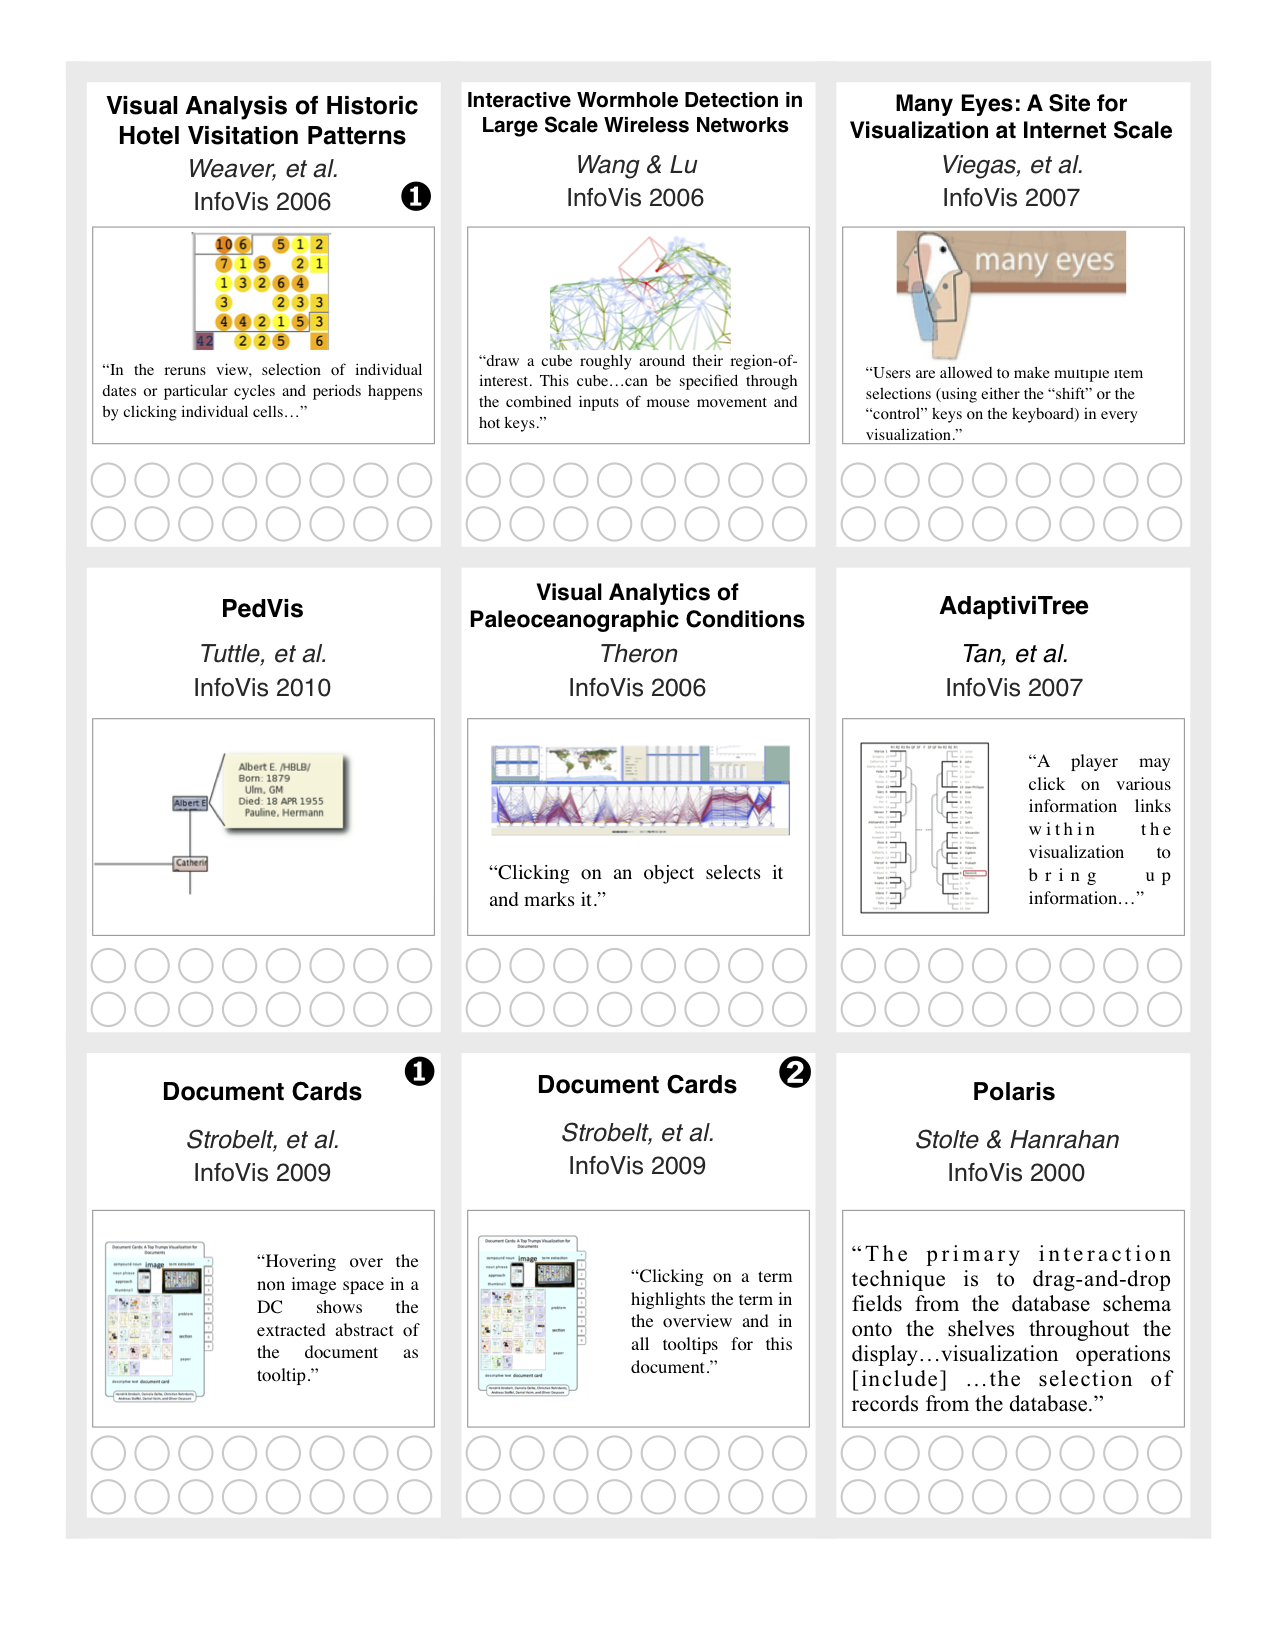
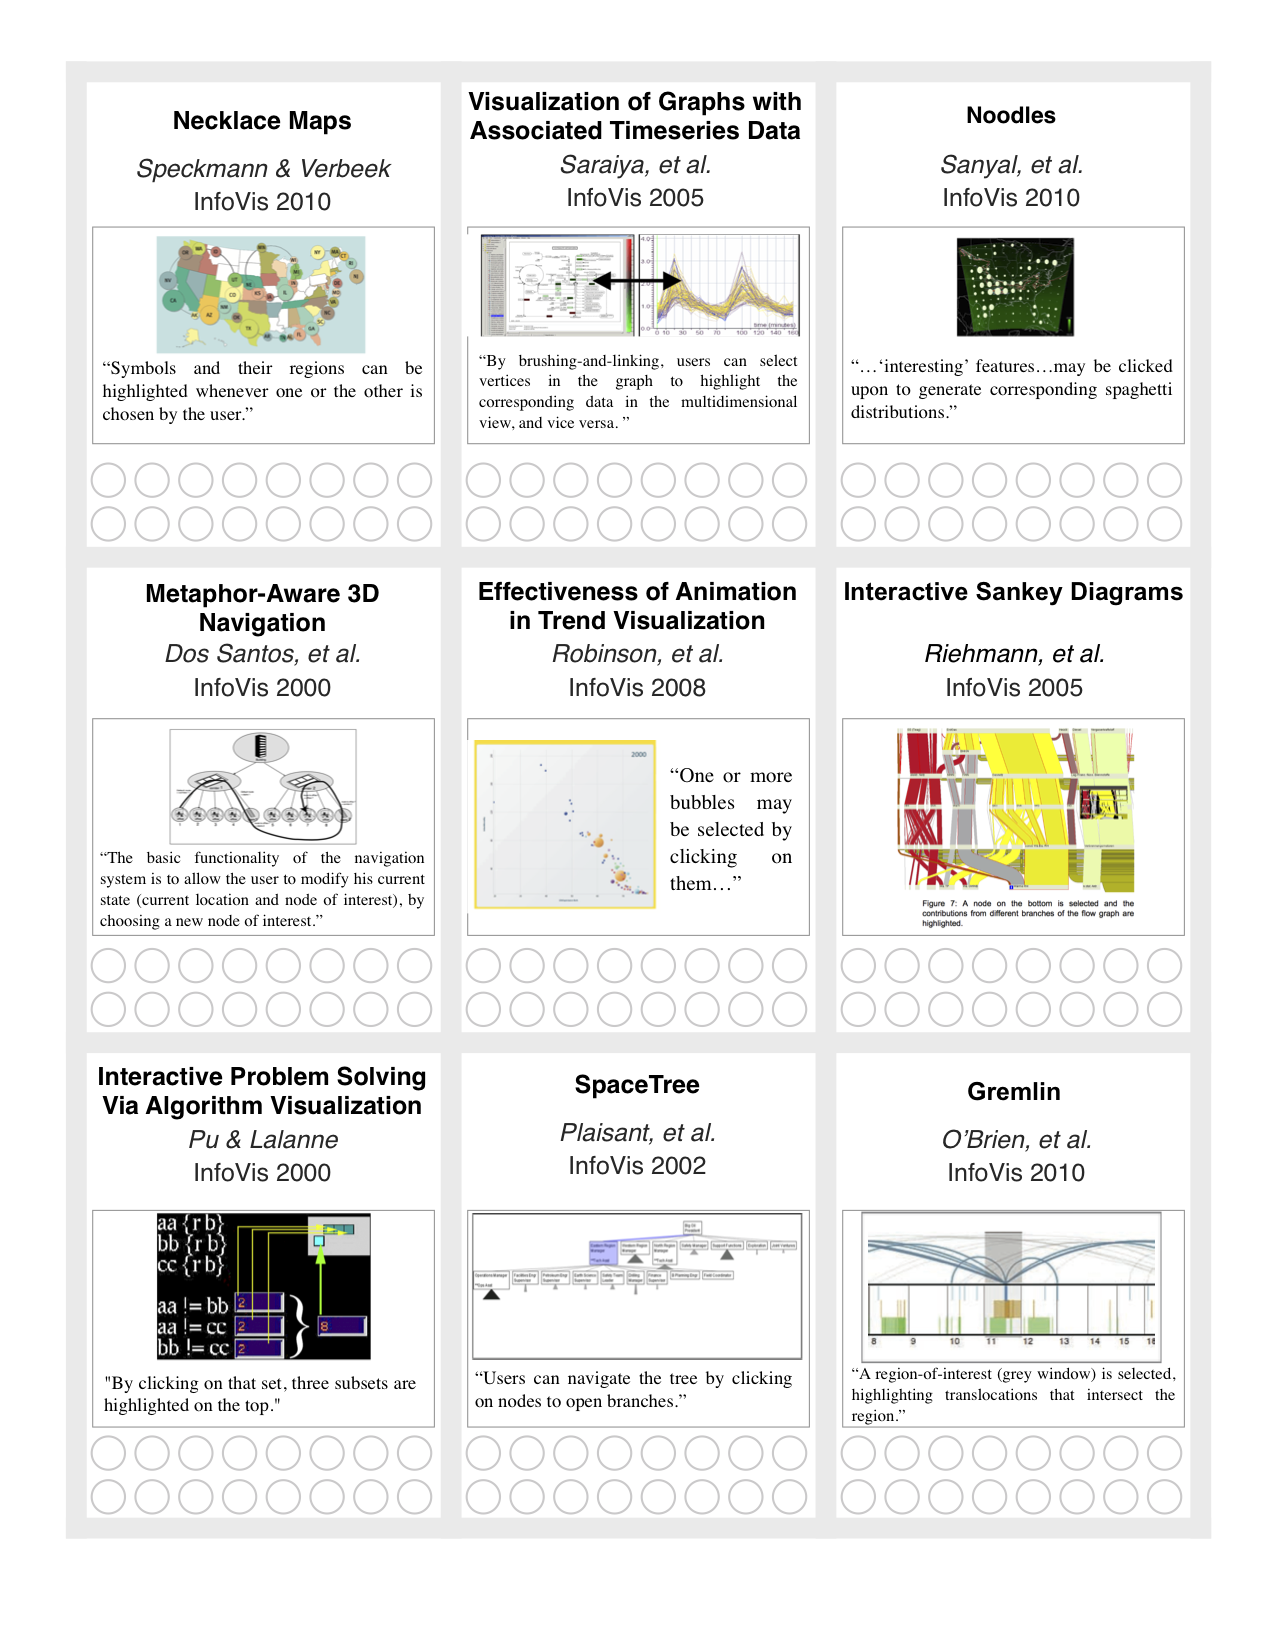
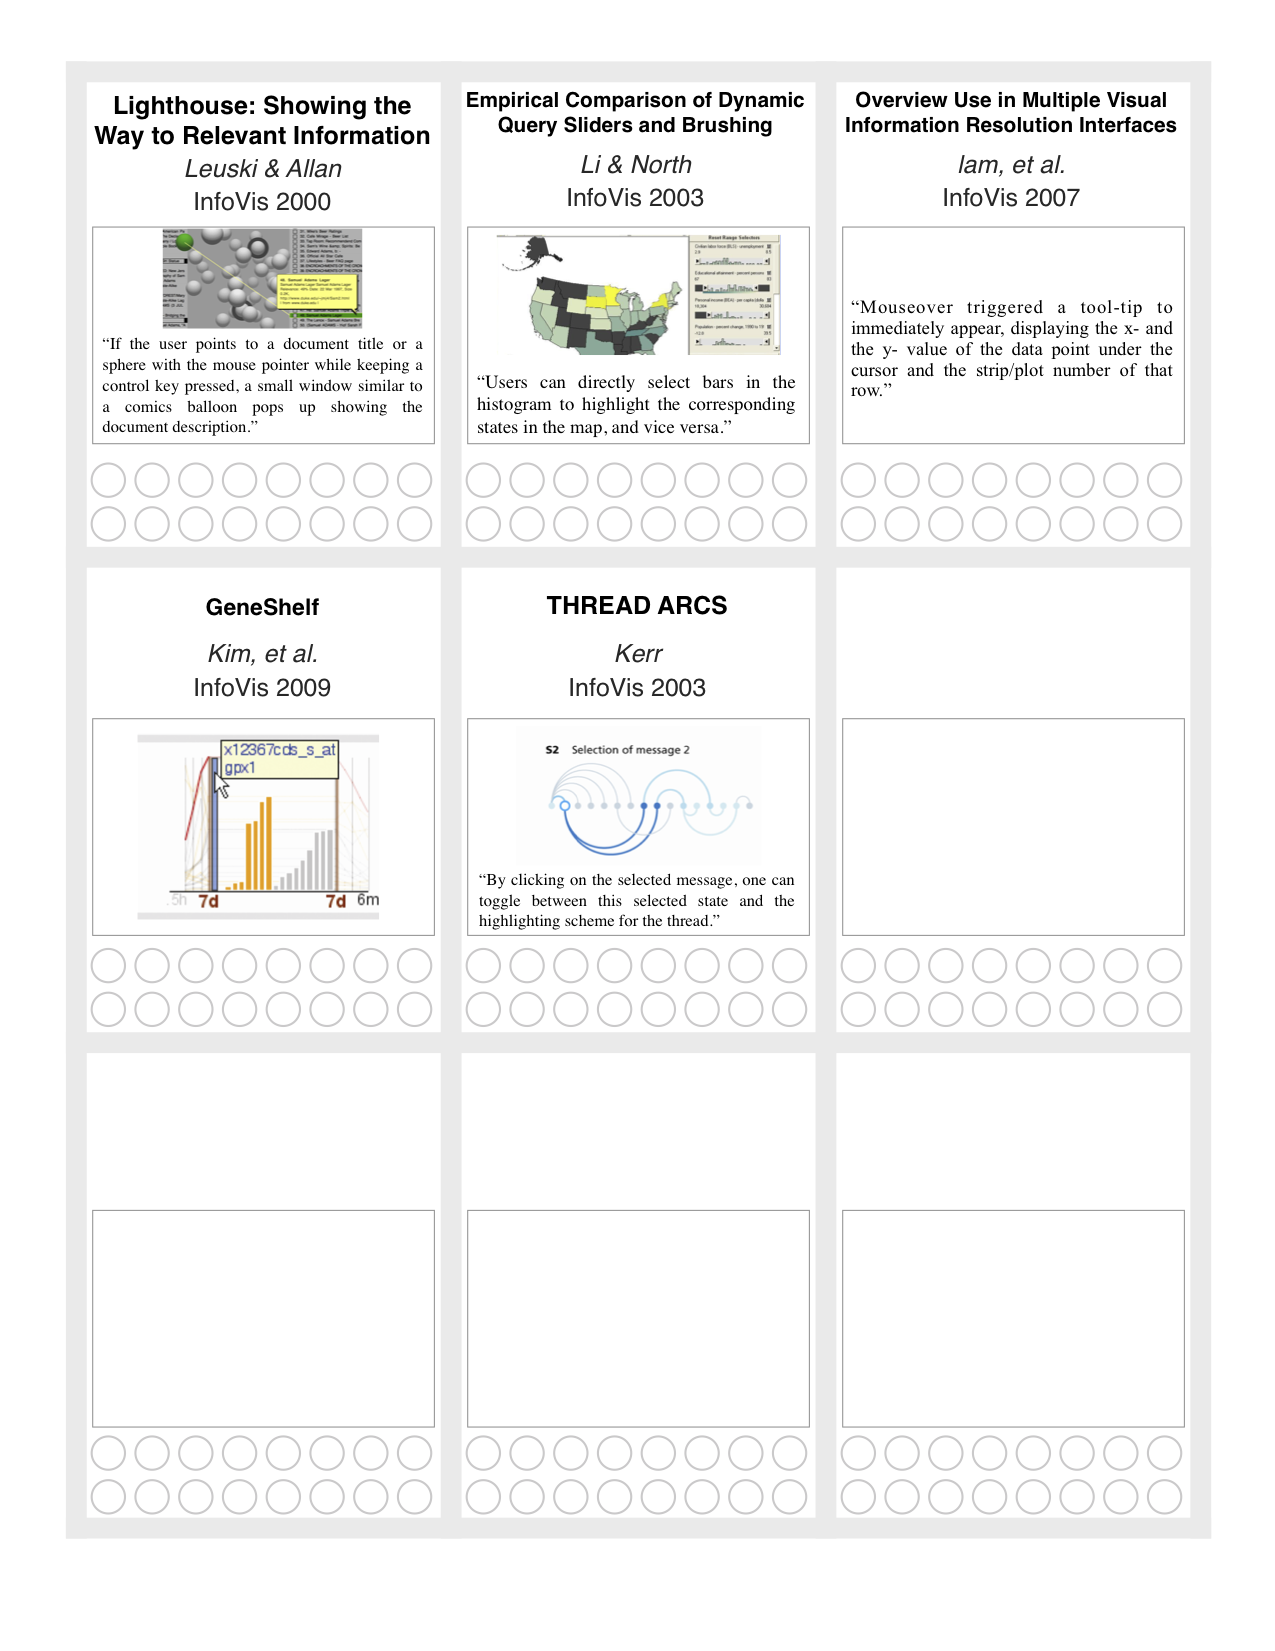
Based on this survey, we created InfoVis paper trading cards as a way to ask InfoVis 2015 attendees to help us classify selection interactions on our poster, Examining the Many Faces of Selection:
Surprisingly, we found that very few visualizations in the InfoVis literature include interactions that can readily thought of as gesture-based data editing interactions. Most interactions are common navigations or variations of basic brushing selection. Many of the remaining interactions are form/widget based data value editors. The latter can be thought of as editing a user-specific boolean-valued attribute for each data item. This result has led us to rethink the role of data editing in information visualization. On the one hand, there are few existing examples from which to determine a taxonomy of editing interactions and from there to define a language for declaring gesture-based interactions in visualization designs. On the other hand, there is enormous opportunity for us to design these interactions with few prior constraints or pre-conceptions, allowing great flexibility and creativity. Our new approach is to map combinations of geometric characteristics of device operations into constrained data value domains, allowing designers to design the data value outputs of gestures as a function of geometric descriptors.
