
Background
I had the pleasure of collaborating with Patrick Laube during his three-month visiting position at the GeoVISTA Center in Fall 2006. Patrick has developed relative motion pattern (REMO) algorithms to analyze group movement behavior in time and space.
Interface
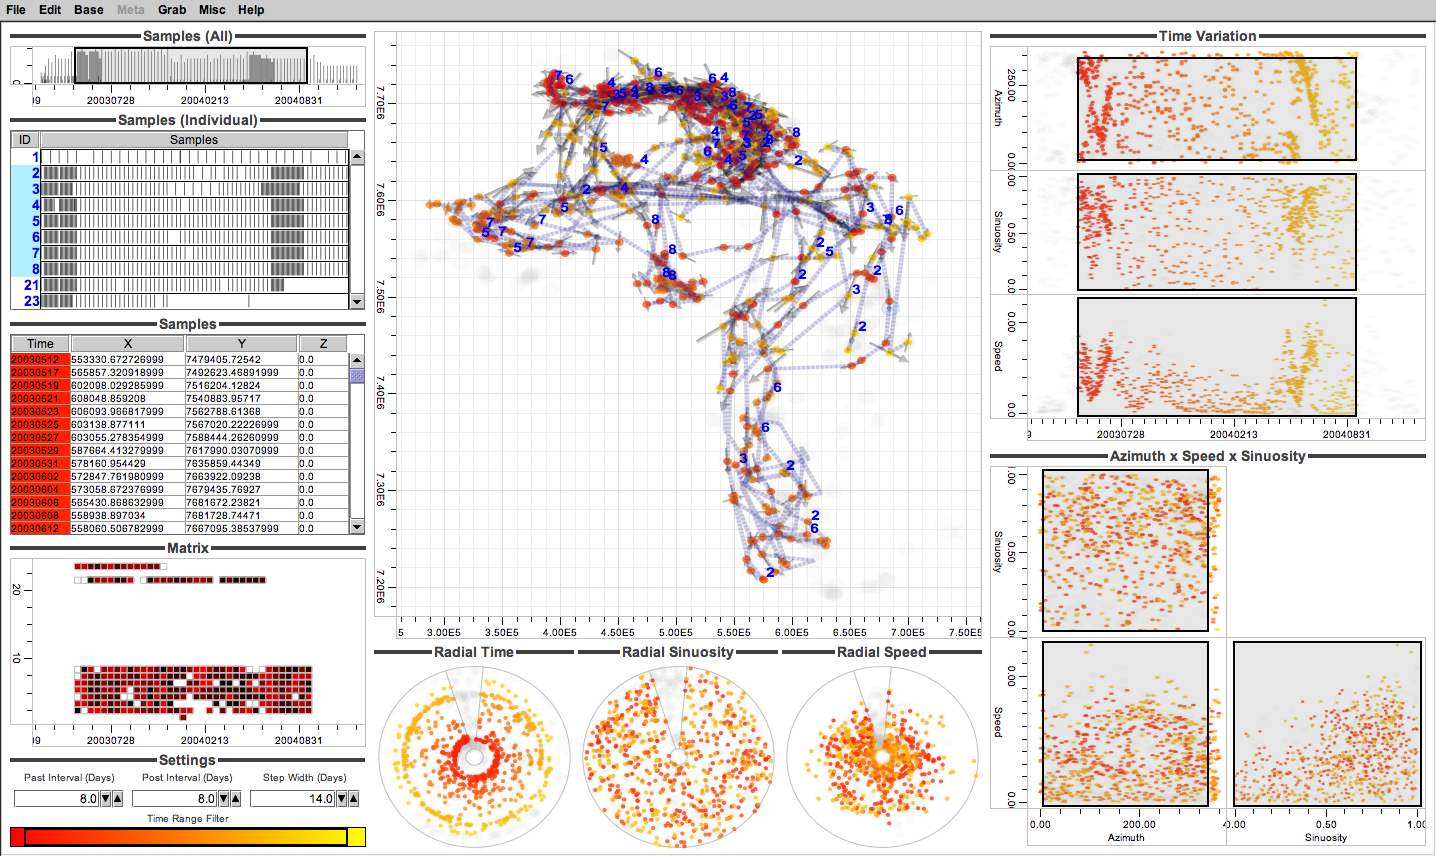
This visualization of caribou herd migration shows a divergence of two groups of individuals in late spring 2003. The main XY view displays individual motion using arrows to represent direction and speed. Various other plots display bivariate relationships between measures points in time and space and values for azimuth, sinuosity, and speed at those points calculated by REMO.
Interaction
The visualization supports selection-based filtering (brushing) on individual caribou and range-based filtering on all of the measure and calculated quantitative data dimensions. Stretching and dragging a span of time limits the analysis to radio collar measurements in that span. Arbitrary selection of individuals (shown as miniature time series at center left) allows isolation and analysis of potential groups of individuals displaying similar movement behaviors in the form of overlapping motion characteristics. Dragging and stretching translucent selector boxes in various views filters the main view to show subranges of time, speed, azimuth (direction), and sinuosity (curviness), thus allowing the user to focus in on specific kinds of movement behavior.
Downloads
Appearances