Cinegraph
Authors and Affiliations:
- Chris Weaver, Penn State University, cweaver@psu.edu
Tools:
- Improvise is a self-contained Java software architecture and user interface for building and browsing highly-coordinated visualizations interactively. (Improvise is available here as a webstart application, along with source code released under the GPL.)
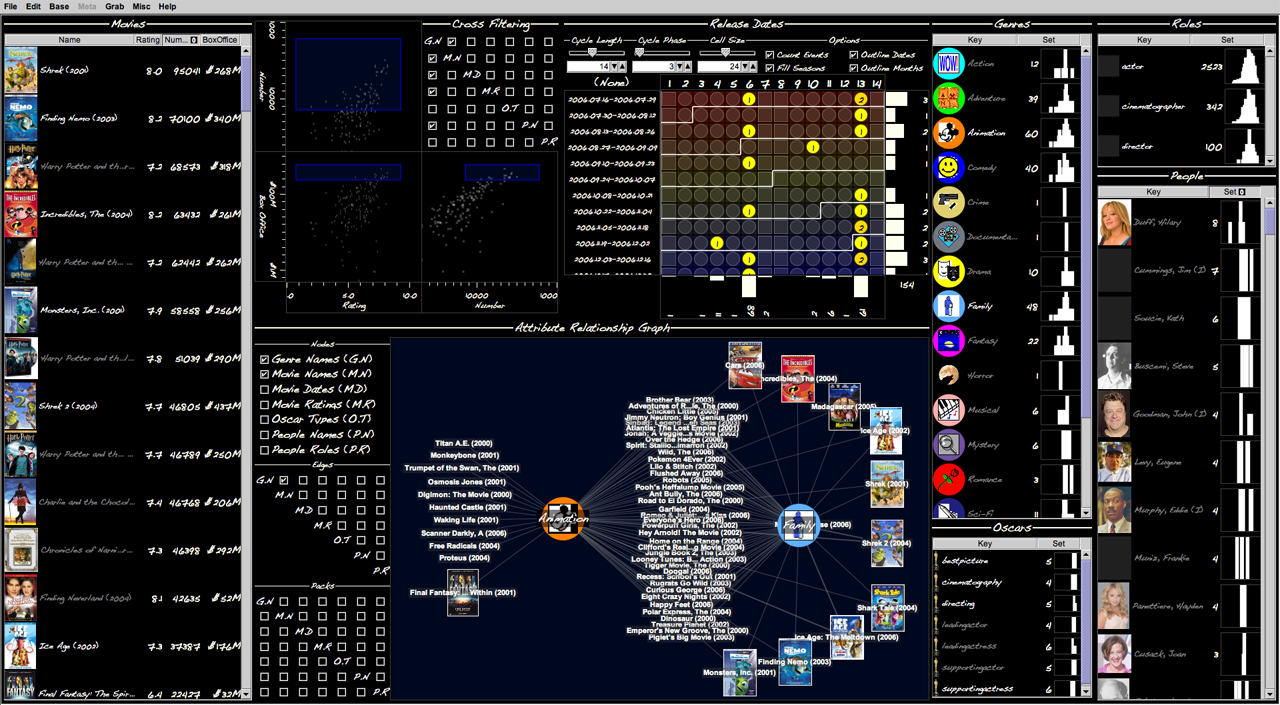
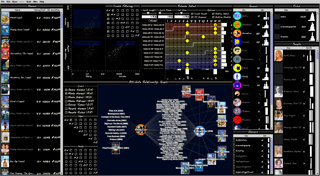
- Cinegraph is an interactive visualization for exploring and analyzing the InfoVis 2007 contest data set as derived from the Internet Movie Database. Designed and built in Improvise by a single visualization designer in a little over two days, Cinegraph provides high-dimensional interactive drill-down capability into the people, genres, awards, release dates, and box office characteristics of movies described in the database, using ancilliary photographs of people, images of movie posters, and icons of movie genres to enhance the interaction process. (Cinegraph is available here as a zipped Improvise document with accompanying data files.)
TASK 1:
-
Question: On what days of the week do movies tend to be released?
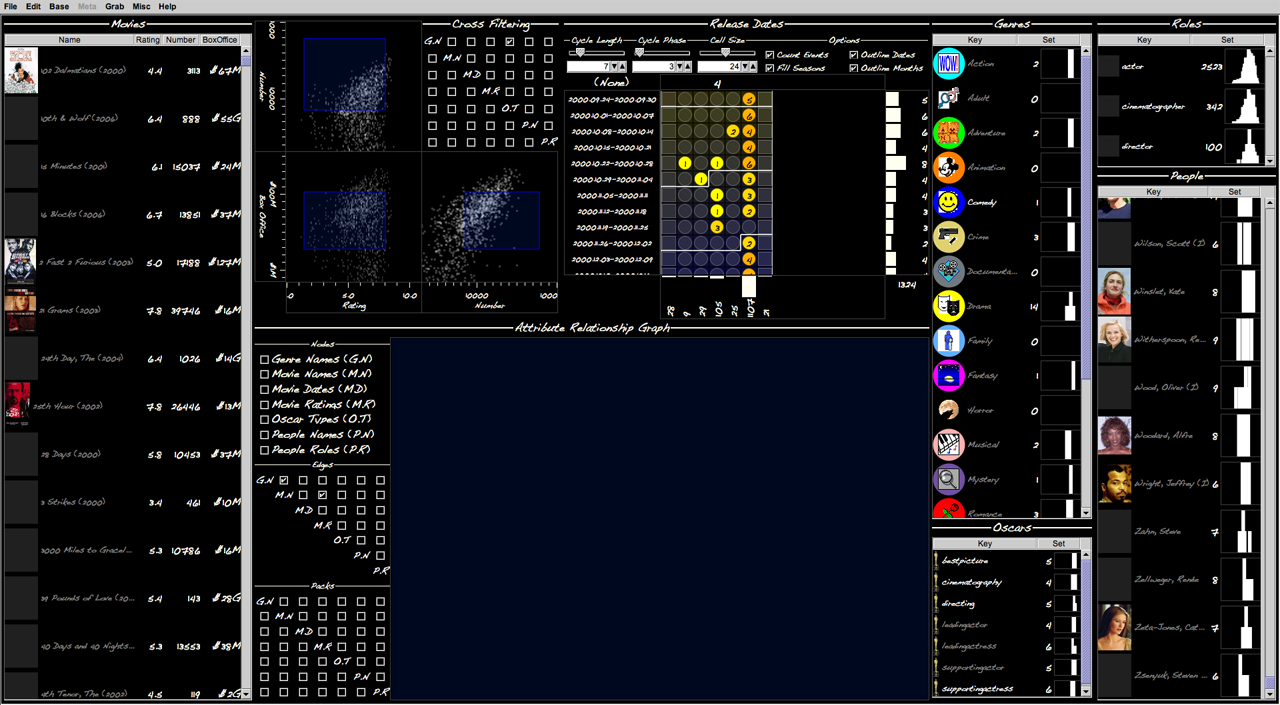
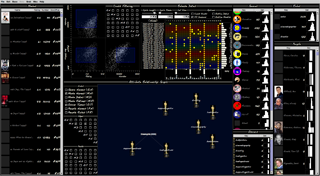
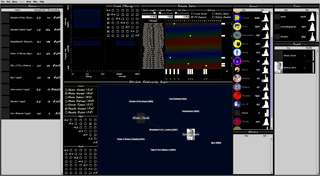
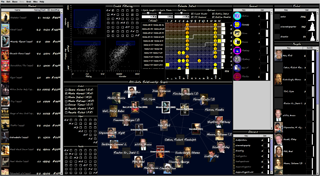
Working in the calendar ("reruns") view [top center], set the cycle length to one week (seven days). Observe the horizontal histogram just below the calendar.
-
Image 1:

-
Insight 1:
The histogram at the bottom of the calendar view reveals that 1107 of 1324 releases occur on Fridays, with a fair number (105) on Wednesdays. Only nine releases happen on a Monday.
-
Caption for exhibit:
(NOTE ON CAPTIONS: There are too many figures on this page to be worth captioning them all at this point. If any of them if chosen for the exhibit, I will gladly compose suitable caption.)
TASK 2:
-
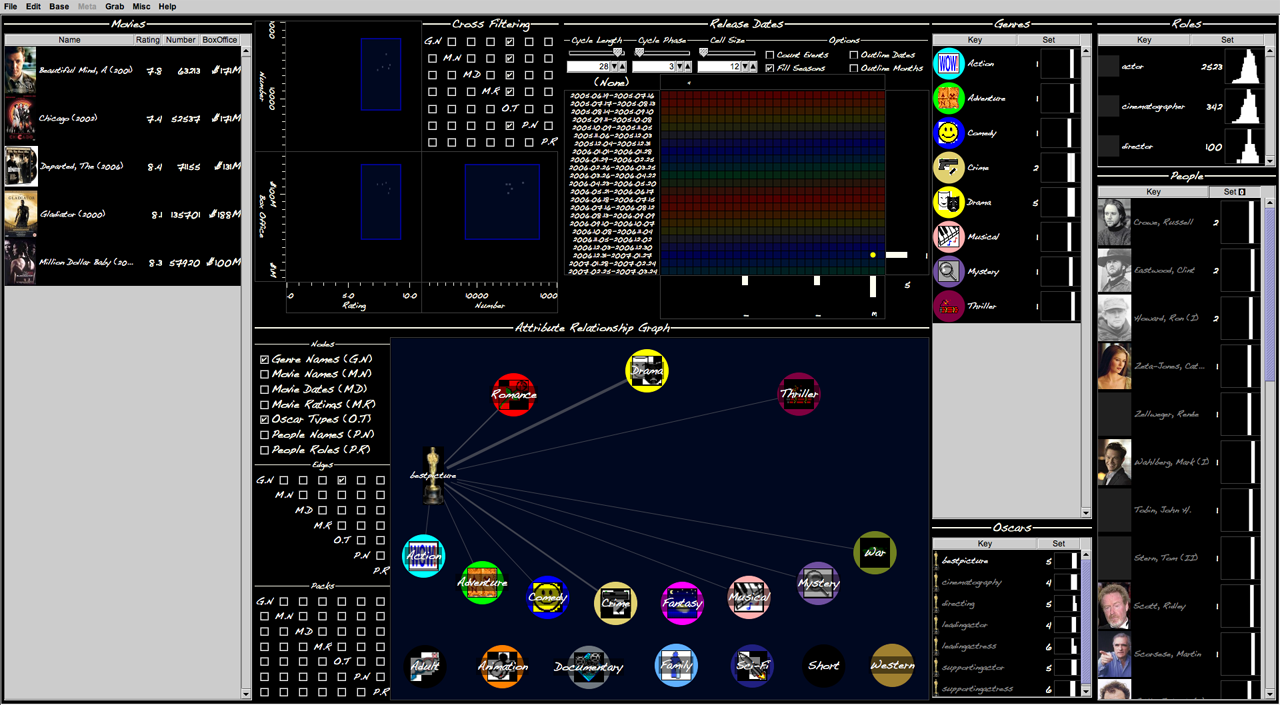
Question: Are any of the Monday releases special in terms of holidays or Oscar wins?
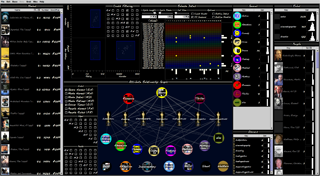
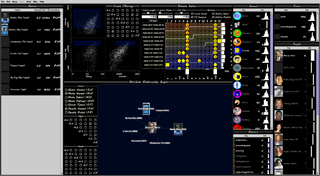
Working in the calendar ("reruns") view, select release dates that are Mondays. In the Oscars table [lower right], select all Oscar types. Cross filter the Movie table [along left side] on release dates ("M.D") and Oscar types ("O.T") by clicking the appropriate check boxes in the "Cross Filtering" matrix [top center, slightly left]. Select other dates to look at movies and Oscars for those dates. To show movie names and Oscar types, turn on the corresponding nodes in the attribute relationship graph [bottom center] by clicking the appropriate node checkboxes on. Show relationships between them as connecting edges by clicking the "M.N"-"O.T" edge checkbox on.
-
Image 2:
-
Insight 2:
Only one of the nine Monday releases, "Dreamgirls (2006)", won any Oscars. The graph reveals that it actually won two: lead actress and supporting actress. One other movie, "Black Christmas (2006)", was also released the same day, which happens to be a holiday (Christmas). Additional cross-filtering of genres and people on selected movies reveals that "Dreamgirls" is classified as both a drama and a musical and that Jamie Foxx and Eddie Murphy both had roles. (Less prefiltering of the people database would have produced more results in the people table.)
TASK 3:
-
Question: When do movies tend to be released throughout the year?
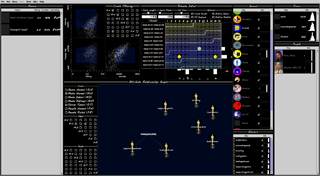
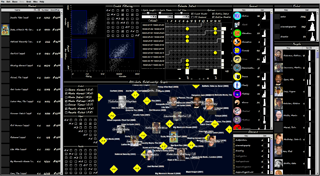
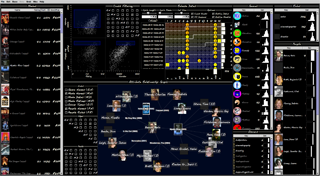
Working in the calendar ("reruns") view, set cycle length to 28 days amd cell size to 12 to show about 2.5 years of release dates at once. Scroll up and down in the calendar to see releases over all six years in the contest data set, observing the vertical histogram to the immediate right of the calendar.
-
Image 3:
-
Insight 3:
There appears to be a binodal distribution every year, with a strong peak in late August to early October and a substantially weaker peak centered around late March. Judging from filled dates in the calendar itself, the distributions of Friday and non-Friday releases each appear to follow a similar yearly pattern. Despite minima in early Januarys, there are still a significant number of releases in contradiction to conventional wisdom about a December "Oscar rush". (The latter could be explored further by filtering dates on Oscar types, then looking for release dates early in the year. Do movies of genres that are rarely or never Oscar winners tend to be released in January more often than genres that are strong Oscar contenders?)
TASK 4:
-
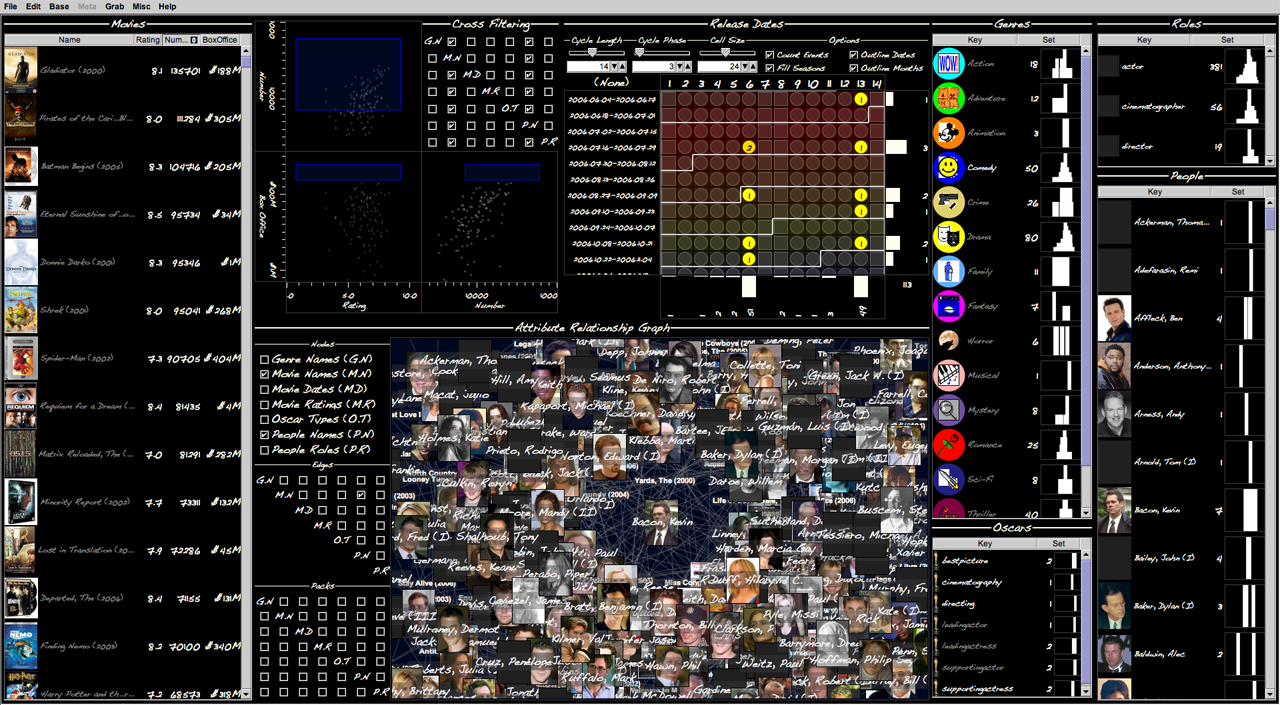
Sequence of questions: What are the biggest release date(s) in terms of number of movies? Which movies were released on these dates? What genres are represented, who was involved, and what are the box office characteristics of those movies?
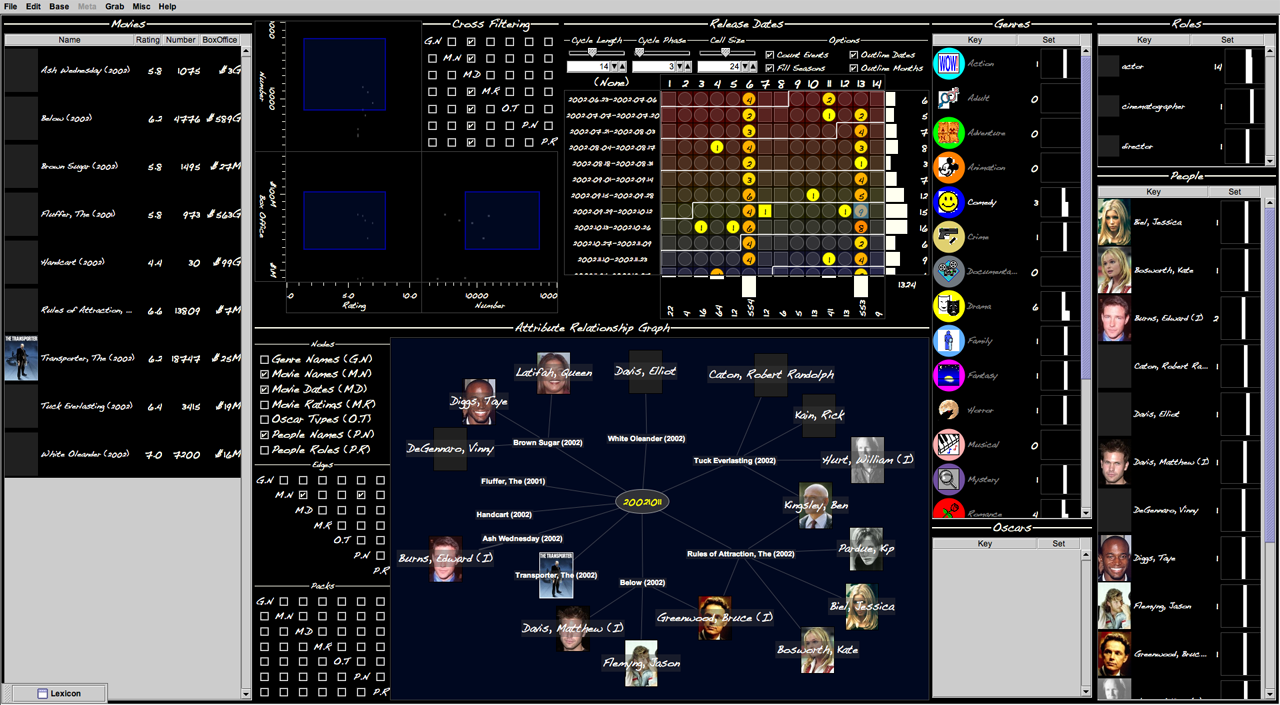
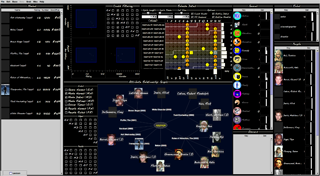
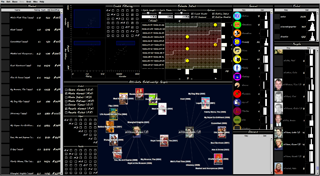
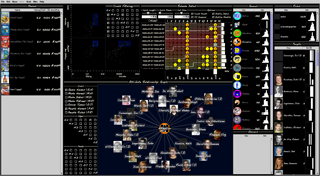
Working in the calendar ("reruns") view, turn on the "Count Events" option, then scroll up and down in the calendar. The fill color of dates and/or the text counts can be used to identify dates with many events compared to others. Select date(s) with many events. Cross filter movies on dates. Cross filter genres, people, oscars, and ratings on dates. In the graph, turn on movie name and date nodes and the edges between them. Select additional or alternate date(s) for individual or collective comparison. To see roles in the movies, turn on people names and their edges to movie names.
-
Image 4.1:

-
Insight 4.1:
There were nine releases on Friday, October 11, 2002. (There are half a dozen other dates with eight releases each.) Of the nine releases, only two have more than 10000 IMDB ratings, and the largest box office take was $27M. Genre counts (in the genres table [second column from right side]) reveal that the movies were mostly romantic dramas and comedies.
-
Image 4.2:
-
Insight 4.2:
The graph reveals that of the major people who had roles in the nine movies on that date, two actors (Ben Kingsley and Bruce Greenwood) each had roles in two of the movies, and worked together on "The Rules of Attraction (2002)". (Design insight for future work: The question "Who had multiple release date roles, and on which days?" would be interactively expressible if it were made possible to filter the graph on the out-degree of people names as connected to release dates. Many other extremely rich questions would become expressible with the capability to filter on the local graph topology of nodes and edges of particular equivalence classes.)
TASK 5:
-
Sequence of questions: Which genres tend to have the highest box office? Which of the highest grossing movies are top-rated? When were they released? Who was involved?
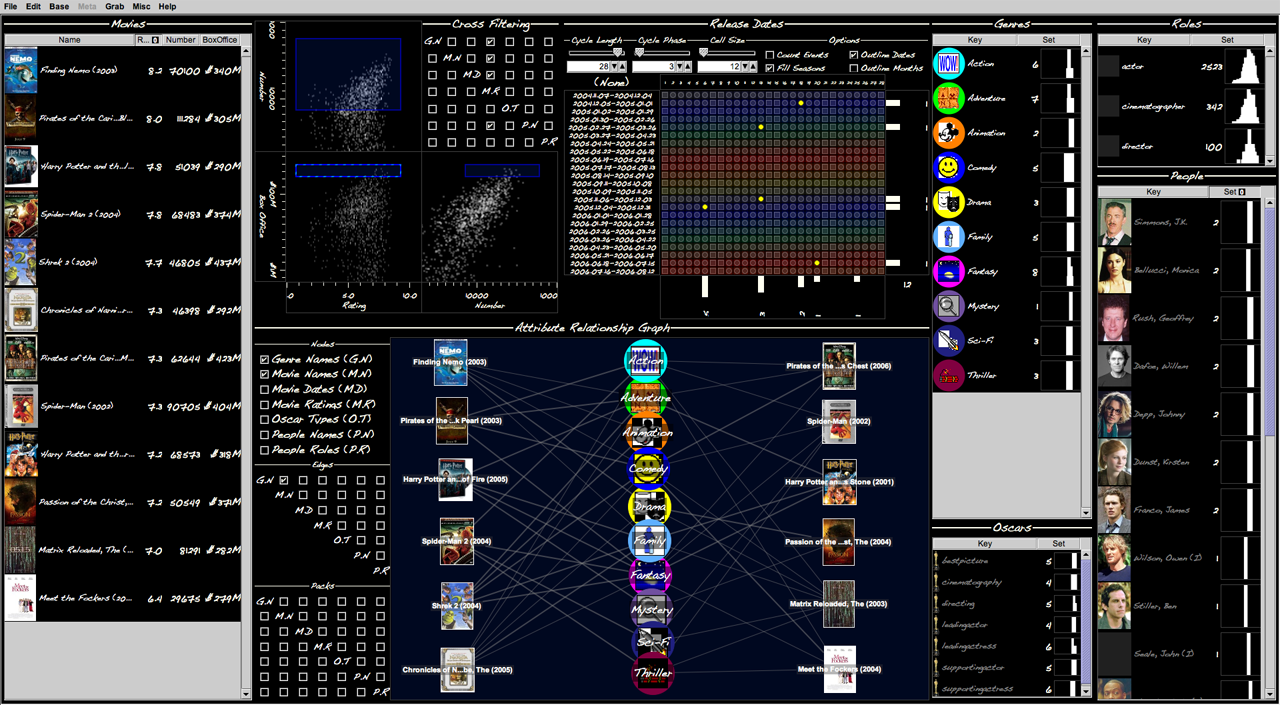
Working in the 3-D scatterplot matrix of box office vs. rating vs. number of ratings, drag and stretch the selection boxes to encompass all movies with very high box office numbers. Cross filter genres on ratings by clicking the corresponding checkbox in the cross filtering matrix. (Note that filtering on "rating" in the interface does so on the cubic 3-D region contained in the selection boxes, and is thus actually a conjuctive filter on all three numeric characteristics.) Cross filter movie names on ratings, then sort the ratings column in the movie names tables. Cross filter release dates on ratings, then scroll the calendar view to observe patterns. Turn on genre names and movie names and their edges in the graph to observe relationships between movies inside the range of selected box office takes. Drag and stretch the selection boxes to change the box office range (or ratings or number of ratings).
-
Image 5:

-
Insight 5:
Counts in the genres table reveal the following ordering for box office: fantasy > adventure > action >> mystery. Scrolling the calendar reveals that every one of the highest-grossing movies was released on a Wednesday or Friday. The people table suggests a wide distribution of A-list actors involved in these movies. The graph reveals that most top-grossing movies tend to be categorized under many (typically 3-4) genres each. (In fact, this pattern holds true for movies of all box office numbers. Overspecification of genres may result from the ability of any user to match genres to movies on the IMDB website. There are two unfortunate design consequences for Cinegraph: first, it is hard to use selection and filtering by genre to drill-down into other movie characteristics, whether using the graph or the tables; second, encoding movie values by mapping genre into color---such as in the scatterplot matrix---does not appear possible to achieve in any perceptually reasonable way.)
TASK 6:
-
Question: Do (movies of) any genres tend to be released at unusual times (of the week or year)?
Turn on cross filtering of release dates in terms of selected genres. Start by selecting the top genre (action), and observe the pattern of release dates over weeks, months, and seasons, noting the aggregate values in the horizontal and vertical histograms. Turning on cross filtering on genres in all views shows more information about that genre.
-
Image 6.1:
-
Insight 6.1:
Short films tend to have a more even distribution of releases over all days of the week. However, this may be a result of the small sample size (nine movies). There is no apparent seasonal pattern. Other genres tend to follow the general weekly and yearly distribution patterns.
-
Image 6.2:

-
Insight 6.2:
Surprisingly, horror films are only slightly more prevalent in the fall (that is, around Halloween). Although about 3% of all films are categorized as horror, none of them have won an Oscar. Nevertheless, horror films tend to perform quite well at the box office (as seen in the movies table). One difference between horror and other genres is the prevalence of average over extreme ratings, as seen in its rating histogram in the genres table and as compared to the more gaussian-shaped histograms of other genres.
TASK 7:
-
Sequence of questions: Which do Oscars relate to genres? To release dates? To ratings?
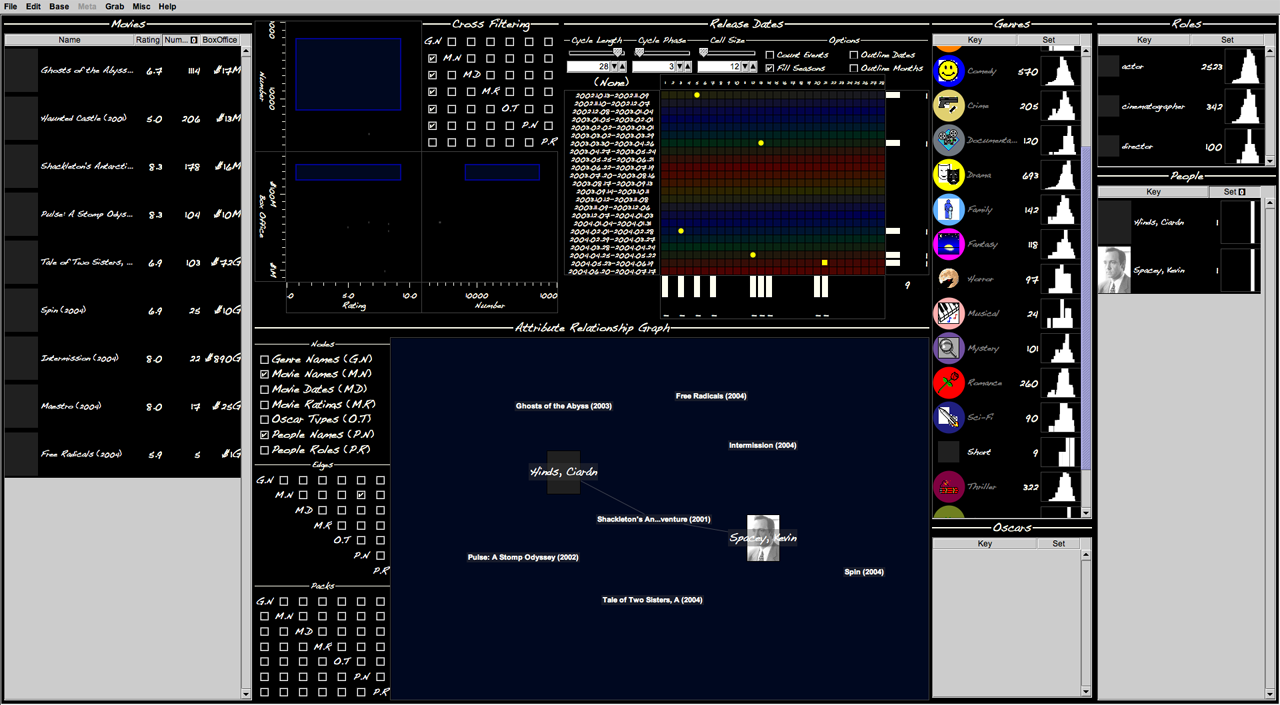
Start by selecting all Oscar types in the Oscars table, then cross filter all other attributes on Oscar type. In the graph, turn on genre and Oscar type nodes and the edges between them. Apply a combination of force-directed and manual layout to separate nodes as needed. In the calendar view, set the cycle length to 28 days, the cell size to minimum (12) and turn on the fill seasons option; scroll up and down to reveal seasonal release dates in earlier or later years. Select one, some, or all Oscars to look for patterns related to particular kinds of awards.
-
Image 7.1:
-
Insight 7.1:
The graph shows that the romance, drama, and thriller genres have garnered Oscars in all Oscar categories, although drama films tend to dominate the Oscars (and indicated by the thickness of the edges between the drama genre node and the Oscar nodes). Scrolling over seasons in the calendar view reveals that Oscar-winning movies tend to be released at the beginning of the blue-colored periods that correspond to late fall/early winter. The movies table and ratings scatterplot matrix show the uniformly high ratings and number of rating (although not always box office) of Oscars included in the admittedly highly-filtered data set.
-
Image 7.2:

-
Insight 7.2:
Further exploration, by selecting only the best picture Oscar, shows that best pictures tend to have high values all three rating measures. Although best picture Oscars seem to be well-represented across genres, the problem noted earlier about overspecification of genres may confound this observation.) Of considerable interest is that there are several years in which no movie won the best picture Oscar, perhaps due to preprocessing of the data set. On a rather cynical note, all five best picture winners had >$100M in box office receipts.
TASK 8:
-
Question: Is there a pattern/tendency in Oscar winning by movies, such as a tendency to win multiple awards?
Starting from the end of task 7, change the graph to show movie name nodes rather than genre nodes, and change the choice of edges correspondingly. In the movies table (which has already been cross filtered on selected Oscar types), select all movie names.
-
Image 8:

-
Insight 8:
The number of edges from movie nodes to Oscar type nodes indicates that nearly all Oscar-winning movies tend to win more than one award. In fact, only three of 22 movies received only one award. Only one movie ("Memoirs of a Geisha (2005)") won five awards. Many movies (nine) win a "modest" three awards. Interestingly, there is no pattern in ratings or release dates apparent in the rating scatterplot matrix or the calendar view. Moreover, the only <$25M Oscar winning was "Pollock (2000)", which received supporting actor and actress Oscars. (Design and exploration insight to this point: The attribute relationship graph technique appears to work very well for two node classes if the density of the graph is relatively low, even if there are significant variations in local density or if the two classes of nodes are of very different sizes.)
TASK 9:
-
Question: Which people tend to have roles in low-rated but high-grossing (say, >$10M) movies?
Start by filtering movie and people on ratings. In the graph, turn on movie name, movie rating, and people name nodes. Also turn on edges between movie names and movie ratings, and movie names and people names, but not between movie ratings and people names. Drag and stretch the scatterplot matrix selection boxes to encompass box office >$10M, ratings < 5.0, and the full extent of number of ratings. Select all movie names in the movies table and people in the people table with many roles (say, >=4, made easier by sorting on decreasing number of roles before selection).
-
Image 9:
-
Insight 9:
Martin Lawrence, Eugene Levy, and Ashton Kutcher, amongst other. No big surprises here. Is that Hilary Duff I see peeking out at the bottom of the people table? :-)
TASK 10:
-
Question: How many movies *have* the Wilson boys (Luke and Owen) been in together, anyway?
Select Luke and Owen Wilson in the people table. Cross-filter the movies table on selected people names. In the movies table, select all visible movies. In the graph, turn on movie names, people names, and edges between them. Apply force-directed layout to the graph.
-
Image 10:
-
Insight 10:
They have only done one movie together! ("The Royal Tenenbaums (2001)".) The large number of movies they have both been involved in makes this a surprising result, but also highlights the need for visual tools in which it is possible to pose a wide range of such specific questions.
TASK 11:
-
Question: Who are the "hub" people? Who have they been in movies with?
Sort the unfiltered people table on number of roles. Select a person at or near the top of the table, that is one with a large number of roles. Cross-filter the movies table on people names, then select all movie names that remain visible. Cross-filter the people table on movie names, then select all people names. Show movie names and people names with edges in the graph.
-
Image 11:
-
Insight 11:
The sorted, unfiltered people table shows that Rick Kain, who appears to be a stand-in actor, has 23 roles in the movies included in the visualized data set. (Kain's tendency toward stand-in roles was discovered by direct refence to imdb.com in a regular web browser. This could have been done by embedding into the visual tool a web browser coordinated with selections in the people, using the imdb.com search capability to retrieve more information about people. This is straightforward in Improvise but was not done for lack of screen real estate.) The filtered people table and graph reveal that Kain has worked with many of the top directors and actors on some of the highest box office and most rated movies. He has also worked with several cast members (including Freeman, Willis, Caton, Tull, and Faison) at least twice. One insight from this graph (and others like it) is that IMDB is overspecific in terms of people as well as genres. In this case, the graph suspiciously shows that the popular actor Cameron Diaz had a role in "Minority Report (2002)", a movie well-known to visualization people! However, the IMDB website lists her involvement as "Woman on Metro (uncredited)". Clyde Tull is similarly uncredited. Without a level of specificity in roles (such as a measure of involvement or a ranking in credits), it is likely that any analysis of the IMDB data set, visual or otherwise, will be prone to many "nearly false positives" in patterns of relationships between people and other movie attributes. Notation with keywords such as "star", "cast", "uncredited", "extra", and "cameo" could be a helpful addition to the data set.
TASK 12:
-
Task: Find the N degrees of Kevin Bacon for the (admittedly small) subset of recent films in the contest data set.
Start by returning Cinegraph to its initial state, i.e. turn all filtering and selections off. Turn on movie names and people names with their edges in the graph. Select Mr. Bacon in the people table. At this point, the graph shows N=0. Filter the movies table on people names. Select all visible movies. Filter people on movies. Select all visible people. At this point, the graph shows N<=1. Select all visible movies. Filter people on movies. Select all visible people. At this point, the graph shows N<=2. Repeat as desired.
-
Image 12.1:
-
Insight 12.1:
For N=0 (after selecting movies), the graph shows that Mr. Bacon has been in seven movies with himself.
-
Image 12.2:
-
Insight 12.2:
For N=1 (before selecting movies), the graph shows 20 people who have been in those seven movies with Mr. Bacon.
-
Image 12.3:

-
Insight 12.3:
For N=2 (before selecting movies), the graph shows in the vicinity of 400 people (I didn't count) who have either been in movies with Mr. Bacon or in movies with others who have. What a mess. With a branching factor of 20 even on such a small subset of the whole IMDB database, no wonder the infamous game is no fun. (Then again, perhaps the problem of overspecified roles as noted in Insight 11 is rearing its ugly head here.) A more far-reaching insight for visual tool design is that it may be fruitful to explore the possibility of reproducing the analytically important functionality of some rather sophisticated data processing algorithms (such a filtering a graph on path length from critical node(s)) using iteration over short sequences of simple interactions.
-
Caption for exhibit:
Image 12.2: Two degrees of Kevin Bacon.
TASK 13:
-
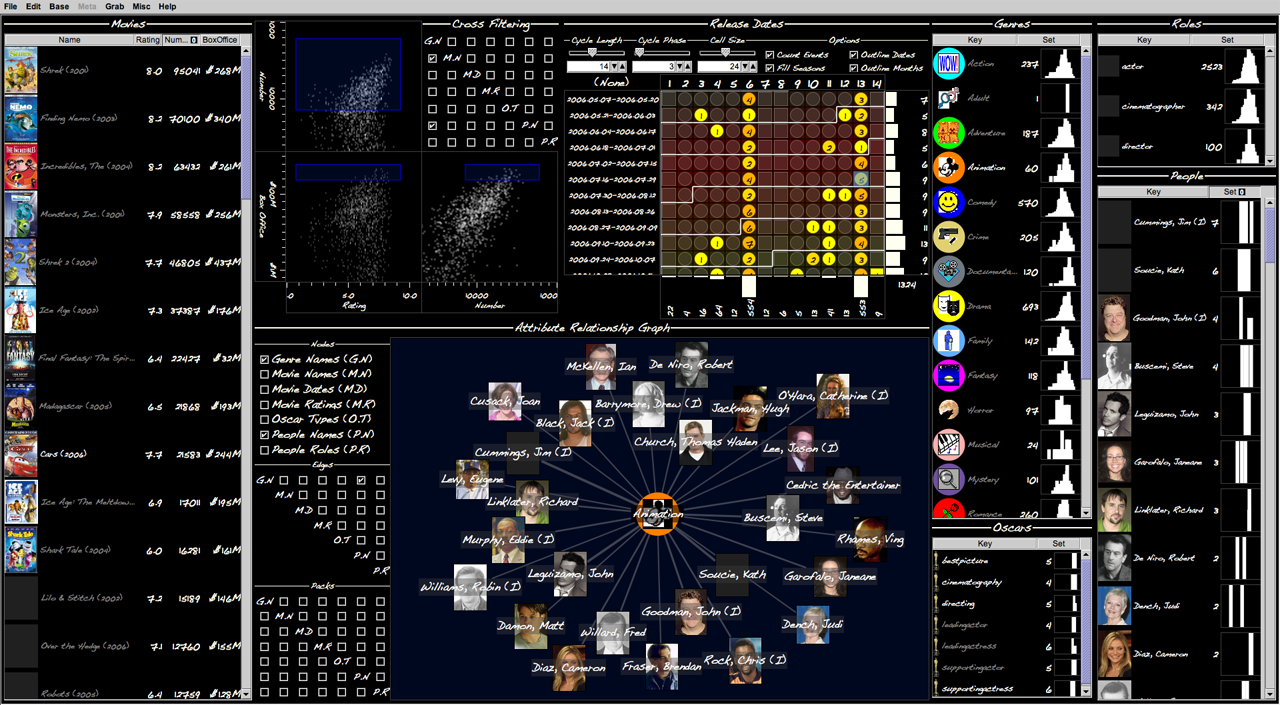
Question: Who has been in an animation film (perhaps by voice acting) more than once? How do animation films do at the box office and at Oscar time?
Filter the people table on selected genres. Sort the people table on decreasing number of roles. Turn on genres and people names with their edges in the graph. Select the animation genre in the animation table, then select all people with at least two roles in the people table.
-
Image 13.1:

-
Insight 13.1:
Jim Cummings is a frequent "animation character actor", with seven roles. John Goodman and Steve Buscemi have both been in four animation films. In real-world analysis, specific answers to specific questions are good things.
-
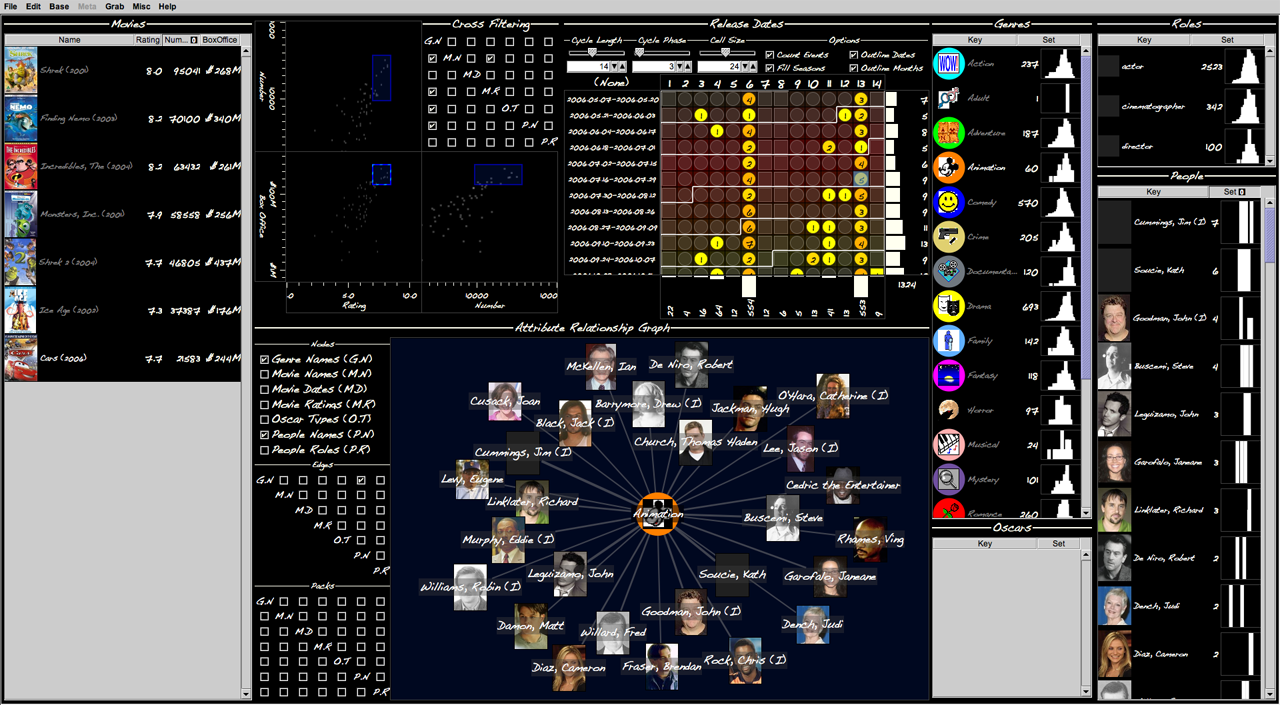
Image 13.2:
-
Insight 13.2:
By comparing the distribution in the scatterplot matricies with the one in Image 13.1, it appears that animation films tend to have high box office relative to the number of ratings. They win no Oscars in the "big" award categories, but a reasonable suspicion is that a more complete data set of Oscars would likely show wins in minor categories. Exploration insight: Coupled with insights from earlier tasks, it appears that the attribute relationship graph is highly useful not only for drilling-down into relationships within data domains, but also for doing so across data domains. Put another way, exploration of relationships between data values of particular attributes is enhanced by the abilty to rapidly switch some or all of those attribute interactively. Unlike so-called "pivot charts", this is a true pivot graph not necessarily restricted to two data dimensions (or even dimensions in the same table).
TASK 14:
-
Questions: Which animation movies are not classified as family movies? How do they do number-wise compared to family animation films?
Select animation in the genres tables. Filter movies on genre. Select all movies. Add family to the selection in the genres table. Show genre and movie names with edges in the graph.
-
Image 14:
-
Insight 14:
Although there are a fair number (11) of non-family animated films, only one ("Final Fantasy: The Spirits Within (2001)") did well at the box office ($32M), although it has a rather mediocre average rating (6.4). Animation films that are also family films tend to be huge at the box office and in rating and number of ratings, even when compared to movies of all genres. Exploration insight: cross-filtering and the attribute relationship graph are both good for analytic tasks that involve comparison between a few values in one dimension with an unconstrained number of values in a second dimension. The comparison between two genres of interest in terms of all movies can be generalized to comparisons of two {movies, people, dates, oscar types, etc.} in terms of all {some other movie attribute}. Moreover, the makeup of the comparison set can be increased, decreased, and shifted interactively by selecting and deselecting items in the corresponding table. Rich questions like "Which movies classified as animation or family are not classified as sci-fi?" can be expressed in the visual interface using this approach.
COMMENTS
Cinegraph can be used to perform many more analytic tasks than could ever be described here. The few representative tasks enumerated above are intended to suggest the flexibility and effectiveness of the information visualization design approaches that have been used in Cinegraph in particular, and that could be reused in Improvise visualizations in general.