
Live properties is a user interface architecture for directly coordinating controls—including views, sliders, and other widgets—through shared objects called variables. Each control defines one or more properties, each of which can bind to at most one variable. properties may be either active (access and modify variables) or passive (access only). Changes to variables are propagated to controls via their properties:
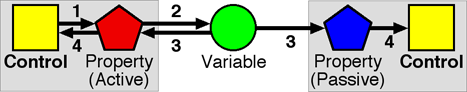
- A control modifies the value of one of its (active) properties in response to interaction.
- The property assigns the new value to its bound variable.
- The variable sends a change notification to all properties bound to it.
- The properties notify their respective parent controls of the change. Controls update themselves appropriately.
Properties serve two purposes. First, they are value slots that a control uses to determine its appearance and behavior. For instance, a scatterplot has two range properties that specify which region of the cartesian plane to show, and a color property that specifies the color used to fill its background. Second, properties act as ports through which controls communicate with each other as a result of interaction. Variables and properties are strongly typed, and binding is type-matched. Each property also has a default value which is used by the control when the property is not bound to any variable.
Example
This simple visualization of excited ion motion demonstrates basic coupled interaction using the Live Properties coordination architecture. The primary visualization consists of four controls: a scatterplot, two axis sliders, and a color editor. The scatterplot is navigationally coupled to its two labeling axes in the usual manner. The color editor provides a way to adjust the fill color of the scatterplot and axes interactively.
Adjusting the color in the color editor changes the value of the background variable. The variable notifies the other three controls of the change by way of their respective background properties. Each control redraws itself using the new color. However, the color value itself is not part of the notification, which only indicate that the value has changed. Instead, controls access the current value of the background variable whenever they need to for redrawing or other purposes.
Changes to range variables between the scatterplot and axis controls propagate similarly. Panning and zooming in the x axis changes the value of its bound x range variable. The variable notifies the scatterplot through its x range property. When the scatterplot redraws itself, it translates and stretches its horizontal extent according to the current x range variable's value. Navigation in the y axis has the same effect in the vertical dimension. Conversely, panning and zooming in the scatterplot changes both range variables, causing both axes and the scatterplot itself to update themselves correspondingly.