AME 3623: Project 3
- All components of the project are due by Friday, March 1st.
at 10:00 am
- Groups are the same as for project 1.
- Discussion within groups is fine.
- Discussion across groups may not be about the specifics of the
project solution (general programming/circuit issues are fine to
discuss).
For this project, you will be reading "image slip" data from a set of
cameras and estimating the distance traveled by the hovercraft in a
given period of time. A key part of this project will be the
construction of a mathematical model that captures this relationship.
This model will allow us, in the long run, to estimate the velocity of
the hovercraft in a coordinate frame centered on the craft.
At the end of this project, you should be able to:
- connect a digital sensor to your microcontroller,
- read digital data into your microcontroller
- display information through a USB serial interface,
- design mathematical models for transforming raw sensor data into calibrated information,
- implement these models in code, and
- test the models.
Component 0: Library Installation
Create a new project in your Arduino environment; copy over the code
that you have developed so far.
-
The OpticalFlowCamera.zip library is in the lib
directory of your Dropbox. To install this library within the Arduino
environment, select
Sketch menu / Include Library / Add .ZIP Library. Navigate to
and select OpticalFlowCamera.zip.
- Do the same for the PeriodicAction.zip file.
You will not need to repeat these steps in the future.
Component 1: Microcontroller Circuit
Your hovercraft is equipped with power circuit and three
downward-looking cameras. When turned on, the power circuit delivers
+5V to the red LEDs that are part of the camera system.
Cameras
The CJMCU-110 Optical Flow Camera pin-outs are shown below:
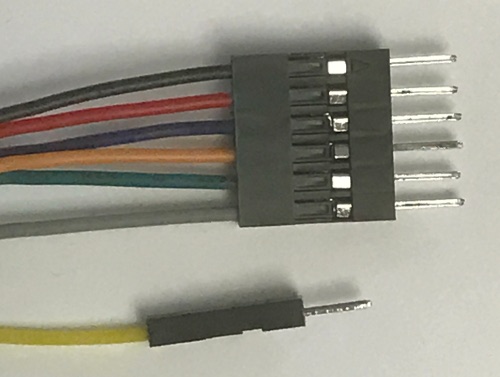
The common lines that are shared across all cameras (and should be
connected together) are:
- Black: Ground
- Red: +5V Power
- Blue: MISO (Arduino pin 12)
- Orange: MOSI (Arduino pin 11)
- Green: SCL (Arduino pin 13)
- Gray: Reset (choose an unused digital pin)
In addition, each camera has its own Yellow line that is used to select
the camera for communication. Each camera must have a unique digital
output pin assigned to it.
Component 2: Regular Execution of Tasks
In embedded systems, there are many situations where you will want to
perform certain tasks at regular intervals. In our implementation, we
will use a package called PeriodicAction to call a function
at an interval defined in milliseconds. Here are the details:
Add the following declarations at the top of your program:
// Promise that we will implement this function later
void camera_step();

// Create a task that will be executed once per 50 ms
PeriodicAction camera_task(50, camera_step);
Implement your loop() function in this way:
void loop()
{
  // Check to see if it is time to execute the camera_task.  If so,
  // then camera_step() will be called

  camera_task.step();
}
Component 3: Camera Interface Software for Data Collection
Write a data collection program:
- Define the camera interface pins at the top of your INO file.
For example, the following code defines the select pins for
cameras 1, 2 and 3 as Arduino pins 8, 7 and 10, and the reset pin as
pin 9.
       ////////////////////////////////////////////////////
       // Global constants

       // Total number of cameras
       const int NUM_CAMERAS = 3;

       // Select pins for the 3 cameras
       const uint8_t CAMERA_SELECT[NUM_CAMERAS] = {8, 7, 10};

       // Common reset pin
       const uint8_t RESET_PIN = 9;
- Also in the global space, create and configure a new object for
interfacing to the camera system:
       /////////////////////////////////////////////////////
       // Global variables

       // Camera interface object
       OpticalFlowCamera cameras(RESET_PIN);
- In setup(), initialize the serial port connected to the USB port (which is
connected to your computer):
Serial.begin(57600);
- Also in setup(), initialize each of the cameras. For example, the following
code will configure and initialize camera 2 (index 1 in the array):
int ret = cameras.addCamera(CAMERA_SELECT[1]);
Here, you explicitly declare pin 7 as being the select line for
this particular camera. This function returns a zero (0) if
the camera was properly detected and initialized. If a zero is not returned, then your code should
print an error and stop. See the
OpticalFlowCamera.cpp file for more details (inside of the ZIP file).
- Implement the following function:
void accumulate_slip(int32_t adx[3], int32_t ady[3])
This function will query each of the cameras for
its slip and image quality measures. For example:
       int8_t dx, dy;
       uint8_t quality;

       int result = cameras.readSlip(CAMERA_SELECT[1], dx, dy, quality);
will query camera 2 (index 1) for its X and Y slip and image
quality. This function returns a status code. When this
status code is zero, the variables dx, dy and quality are
changed by this function call to reflect the slip since the
last time the camera was queried. This changing of the input
variable values is a feature provided by C++ (and is a new
feature from what you are used to in C).
If the status code is -1, this indicates an overflow (because
dx/dy can only encode pixel changes of -128 ... 127).
If this error does occur, then your function should alert you to the problem.
In this
situation, increase the rate at which you are querying the camera.
If the status code is -2, this indicates that no slip has been
detected (e.g., the hovercraft has not moved). In this case,
dx/dy/quality should not be used (it is safe to assume that
dx=dy=0).
Your function should accumulate (sum) the slip values using the adx/ady variables.
Note that in C, arrays are pass-by-value (changes to the individual array elements
will be visible in the calling function).
- In camera_step():
Component 4: Data Collection
- We have set up a test field in FH 300. This board has a
distance of one meter marked on it.
- The forward direction of your craft is opposite to your mast. We will call this the +X
direction.
- Place your hovercraft chassis at the start line, facing
forward on the craft to the end line. Clear
the accumulated values. Slowly move your craft to the
end line (do not rotate the craft). Record the accumulated values (6 values in total) in
the following order: camera 1 dx/dy, camera 2 dx/dy and camera 3
dx/dy. In three separate columns, record a movement along the X
direction of one meter, a movement along the Y direction of
zero meters and a rotation of zero radians (i.e., these columns
should be 1, 0, 0).
- Repeat this process a total of 10 times.
- Place your hovercraft chassis at the start line, facing with
its left side to the end line (we will call this the +Y
direction). Perform the same procedure as above, while moving
the craft one meter to its left. Record the accumulated
values, adding three more columns: 0, 1, 0.
- Repeat this process a total of 10 times.
- Place your hovercraft chassis anywhere on the board. Clear the
accumulated values. Rotate the chassis by one full rotation
without translating the center of the chassis.
Record the accumulated values, adding three more columns: 0, 0,
360 (degrees)
Component 5: Sensor Model
The result of your data collection process is a matrix of 30 rows and
6 columns, representing the accumulated slip measured by each camera
for 30 different cases. This matrix is associated with another matrix of
30 rows and 3 columns, representing the known movement of the chassis along
X, Y and theta for each of the 30 cases. We will use multi-regression
to derive a linear function from the accumulated slip values to the chassis movement values.
Specifically, we wish to solve for functions of the following form:
X = a1 * adx1 + a2 * ady1 + a3 * adx2 + a4 * ady2 + a5 * adx3 + a6 * ady3
where a1 ... a6 are the coefficients of our function, adx?/ady? are
the accumulated slip values for the x and y directions for each
camera, and X is the motion along the chassis' X direction. Note that we
will have corresponding functions (and coefficients) for Y and theta.
See the instructions
for performing multi-regression in Excel.
See the instructions
for configuring Excel for regression if you have not yet used
Excel to perform regression tasks.
In the Summary Output from the regression process, you will
find a column labeled Coefficients. These are the parameters of
the linear model that result from the regression process (a1 ... a6)
from above. NOTE: there is no bias term in our equation (this must
be the case for yours, too).
Component 6: Implement the Model
Implement a function of the form:
void compute_motion(int32_t adx[3], int32_t ady[3], float[3] motion);
where adx and ady are arrays representing the accumulated slip values
from each of the cameras, and motion is an array representing the
motion along X, Y and theta, respectively. This function will take as
input adx and ady, and fill in the values for the motion array. The
motion values are in units of meters, meters, and degrees,
respectively. Hence, any change to motion by this function will be
visible to the calling function.
In camera_step(), call this new function (after accumulate_slip()) and
print out the motion values.
Component 7: Testing
- For each of the same movements used during data collection,
record the reported X/Y/theta motion.
- Repeat each five times.
- Report in graphical form the mean and standard deviation of the
X/Y/theta (for a total of 9 different means/standard
deviations). There should be one graph each for X, Y and theta.
What to Hand In
Submit to your project3 folder of your Dropbox folder by
Friday, March 1st at 10:00 am.
- Documented code. The documentation requirements are
the same as in project 1.
- Raw data: include the Excel spreadsheet containing your
raw data and the fit model parameters.
- Figures: your test results (JPG, PNG, PDF or EPS format).
Other components:
- Demonstration/Code Review: All group
members must be present. This review must be completed by
Tuesday, March 5th. However, it is better to complete these reviews
as early as possible.
- Personal report: a survey will be issued through Catme.
These surveys must be completed in order to receive a grade for
this project.
Grading
-
Personal programming credit: this project offers one programming credit.
-
Group grade distribution:
- 35%: Project implementation
- 25%: Demonstration of working project (to either
of the TA or the instructor)
- 40%: Code documentation and figures
-
Group Grading Rubric
-
Grades for individuals will be based on the group grade, but weighted
by the assessed contributions of the group members to the non-personal programming items.
andrewhfagg -- gmail.com
Last modified: Tue Feb 19 01:40:01 2019