
Background
There are hundreds of visual representations of the chemical elements and their organization available on the web. A tiny text file (17KB) is sufficient to capture key information about the chemical elements including atomic number, name, symbol, crystal structure and several physical properties of each element as referenced from various sources. An additional utility data file serves to map atomic numbers into positions in the well-known layout known as the periodic table of the elements. Files containing icons which depict various crystal structures take up about another 18K.
Interface and Interaction
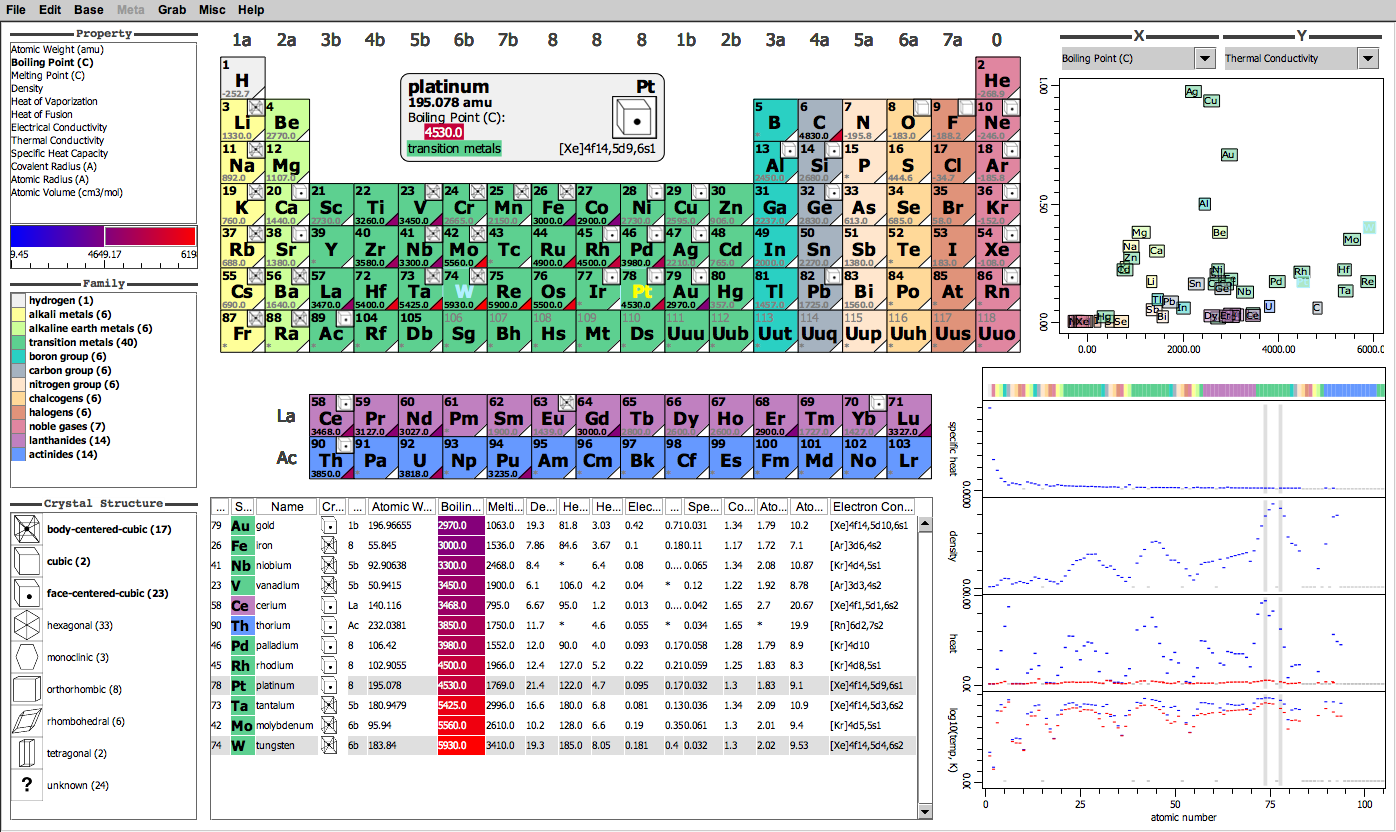
The visualization displays the well-known layout of elements, commonly referred to as the periodic table. Each element is shown in the layout as a rectangle which is color-coded by family and contains an atomic number, symbol, crystal structure (icon), property value, and color-mapped property value (triangle). The user can change the displayed property by selection in a property list, and filter the visualization to a subrange of property values. Selecting families and crystal structures in lists cause the layout view to restrict display of relevant information to conforming elements.
The user can select elements (here tungsten, W) for highlighting throughout the visualization by clicking rectangles in the layout. Whenever the mouse is inside one of the rectangles, a summary of the properties of the corresponding element (here platinum, Pt) appears above the transition metals, and the element's symbol is highlighted. (Different highlight colors are used to differentiate selected elements from the element the mouse is over at any given time.)
A table displays all the information for the elements in the selected range of atomic numbers (see below), sorted on the selected property. The user can override the ordering by clicking in one or more column headers.
The visualization allows comparison of physical properties as a function of atomic number in a stack of four scatterplots. The bottom two plots have two layers which show heat of vaporization (blue) over heat of fusion (red) and boiling point (blue) over melting point (red). A header plot shows the family of each element as text and a color-coded rectangle. Horizontal panning or zooming in any of these views changes the range of atomic numbers shown in all of them; when the user zooms in enough, the plot provide more detail by drawing each element as the element's symbol instead of a simple rectangle.
Two combo boxes let the user select two properties of a bivariate plot (upper right) in which each element is drawn as a textbox centered at the xy point determined by the element's two property values. Element family determines textbox fill color.
Downloads
Appearances