
Background
Cinegraph is an interactive visualization for exploring and analyzing the InfoVis 2007 contest data set derived from the Internet Movie Database (IMDB). By combining two complementary visual interaction techniques, cross-filtered views and attribute relationship graphs, Cinegraph supports a wide variety of general and highly focused analytic tasks. Users can express complex lines of questions in the form of rapid sequences of simple interactions. Designed and built in a little over two days by a single visualization designer using the Improvise visualization environment, Cinegraph provides high-dimensional interactive drill-down capability into the people, genres, awards, release dates, and box office characteristics of movies described in the database, using ancillary photographs of people, images of movie posters, and icons of movie genres to enhance the interaction process.
Interface
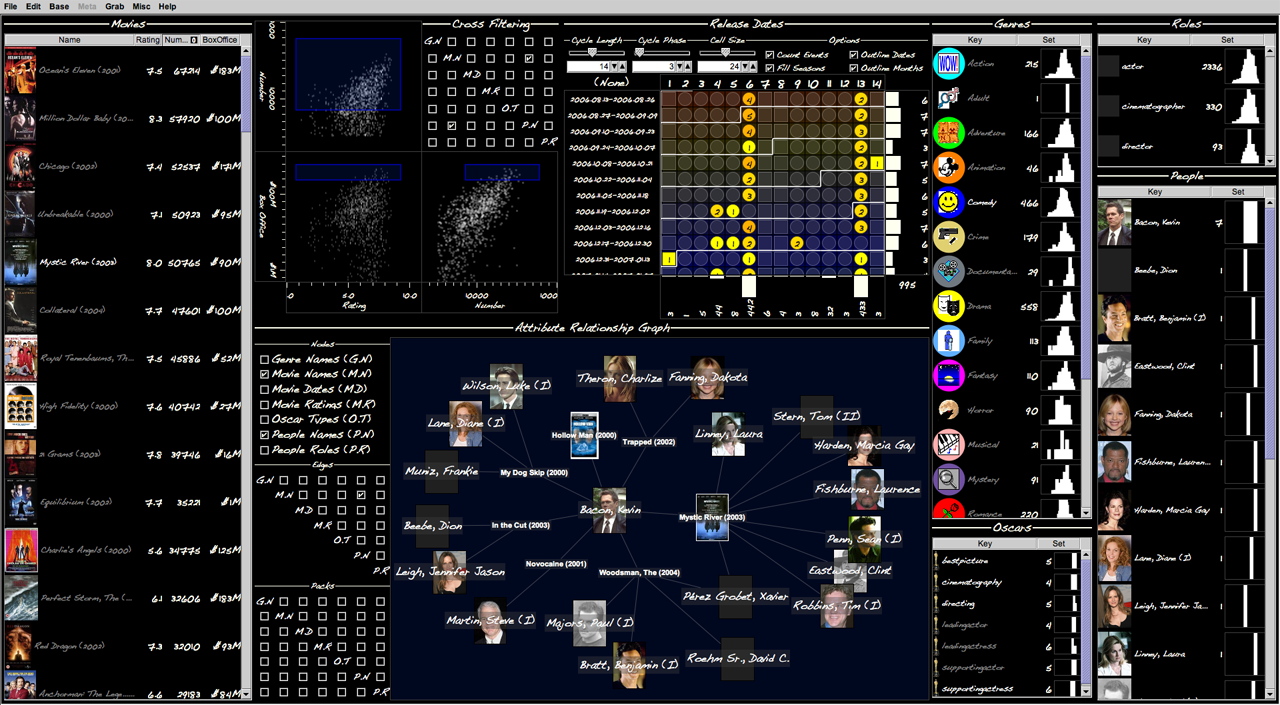
The visualization maps seven key aspects of the movies database — movies, ratings, release dates, genres, Oscars, people, and roles — into coordinated views laid out in seven areas around the edges of the user interface:
- a table of
Movieswith average rating, number of ratings, and box office take, - a table of
Genreswith number of movies and a nested histogram of rating counts for those movies, - a table of
Oscarswith number of movies and a nested histogram of rating counts for those movies, - a table of
Peoplewith number of roles and a nested histogram of rating counts for those roles/movies, - a table of
Roleswith number of movies for each kinds of role and a nested histogram of rating counts for those movies (not fully developed and having strange semantics, so should be considered a placeholder), - a wrapping calendar of
Release Dateswith the number of movies on each date shown as color and text, and - a 3-dimensional scatterplot matrix for comparing average rating, number of ratings, and box office take over movies, with rubberbands for selecting subsets of movies inside ranges of these values.
- Cross-filtered views provide drill-down set queries across multiple tabular data columns by turning on and off brushing of arbitrary sets of attribute values, as originally developed in the hotels visualization.
- Attribute relationship graphs are node-edge-pack diagrams that support exploration of attribute value cooccurrences across two or more columns of tabular data using a multigraph representation that can be dynamically filtered on selection of columns as well as on selection of arbitrary subsets of attribute values in those columns.
Cross Filtering matrix. This combination provides a fully-filterable mapping of the top two levels of an N-dimensional data cube into the nodes and edges of the Attribute Relationship Graph at the center of the interface.
Interaction
Users pose complex inquiries into relationships between the seven database attribute in the form of simple sequences of interactions. For instance, the user might be interested in the social network of people who have been involved in movies together, as in the infamous six degrees of Kevin Bacon game. The visual state in the figure is achieved by turning on movies, people, and their edges in the graph, then selecting Mr. Bacon in the people table. At this point, the graph shows
N=0, the movies in which he has been in with himself. Next, filter movies on people, select all visible movies, filter people on movies, then select all visible people. At this point, the graph shows N<=1, the people who have been in a movie with him. Further degrees on separation are a matter of repeating this interaction sequence. For N<=2, the graph contains around 400 people.
To help with analysis of larger sets of attribute relationships, the graph is implemented so as to support manual and force-directed layout even while it is undergoing dynamic filtering and other coordinations. Packs provides an alternate means of visually collecting nodes into relationships clusters for arbitrary pairs of attributes.
In the screenshot above, the visualization shows all people who have been involved in one of Kevin Bacon's seven movies from 2000-2007. This is just one of the many kinds of analysis tasks possible in the Cinegraph visualization.
Downloads
Appearances