 |
Andrew H. Fagg
This is a programming exercise. It is due at 5 pm on Thursday, October 25th.
When a hungry frog is presented with a fly, he will snap at (and eat) the fly. When presented with multiple flies or stimuli that look like flys, the frog is faced with the problem of selecting one of the discrete objects before initiating a snap. As it turns out, frogs are also quiet good at taking into account the ``flyness'' of the stimuli in making the target selection (Ingle, 1968).
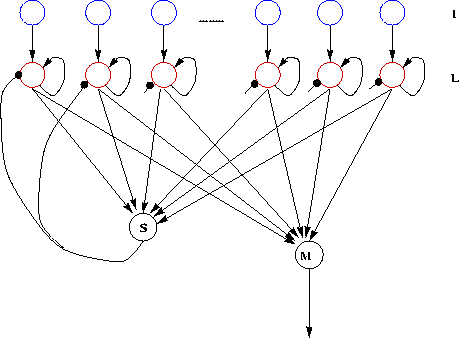
Didday (1970, 1976) suggested a winner-take-all circuit that selected one target from many. Amari and Arbib (1977) proposed a a biologically-inspired, distributed model of this circuit (figure 1). We assume a one-dimensional retina which delivers a value for each retinal position that corresponds to the ``flyness'' of a stimulus at that position (with a zero corresponding to no fly). This retinal input (I) is fed to a selection layer (L) which has the same dimensionality as the retina. These selection cells drive both a global inhibitor (S) and a motor output (M) that determines the direction of tongue snap.
The dynamics of these cells are defined as follows:
 |
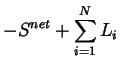
= | - Lneti + Ii + Li - S | |
| Li | = | 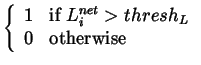 |
|
 |
= |  |
|
| S | = | 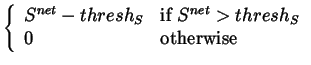 |
|
 |
= | -M + T | |
| T | = | 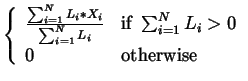 |
I is the vector of retinal inputs; Linet and Li are the membrane potential and activation level of the i'th selection cell; Snet and S are the membrane potential and activation level of the inhibitor neuron; M is the motor output (indicating direction of snap); and Xi expresses the direction of snap given a selected stimulus at the i'th retinal location.
Note that once the global inhibitor is activated (by one or more of the selection units), it generates an inhibitory signal that suppresses the activation of all of the selection cells.
An experimental trial is conducted as follows:
Assume the following parameters:
| = | 21 | ||
| timestep | = | ||
| = | |||
| = | |||
| = | |||
| threshS | = | 0.1 | |
| threshL | = | 0.5 | |
| Xi | = | i-1 - (N-1)/2 |
Assume a stimulus at location 4 and ``flyness'' of 1 (i.e. I4 = 1).
Question 1.1:
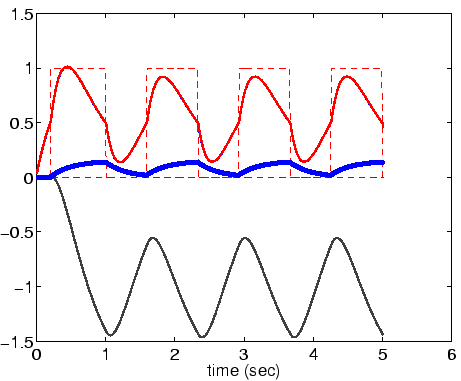
How long before our ``frog'' snaps? Show the evolution of the
relevant state variables in a figure (i.e. L, Lnet, and M).
Answer: Approximately ![]() .
In the figure, the cyan solid and
dashed lines correspond to Lnet4 and L4, respectively; the
red line is Lneti for
.
In the figure, the cyan solid and
dashed lines correspond to Lnet4 and L4, respectively; the
red line is Lneti for ![]() ;
and M is shown in blue (note
that it is scaled by a factor of 10 for display purposes, and
converges to a real value of -7).
;
and M is shown in blue (note
that it is scaled by a factor of 10 for display purposes, and
converges to a real value of -7).
Question 1.2:
Explain the occurrence of the peak in Lnet4 - i.e. why does the
level drop after the peak?
Answer: This is due to the growing inhibition of the S unit.
Question 1.3:
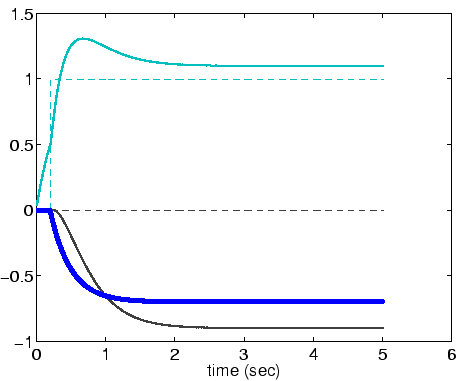
If the flyness is only 0.55, how long before the snap occurs? Explain the
difference?
Answer: About ![]() .
Because the input level is lower, L unit 4
does not charge as quickly, which results in the delay in establishing
an equilibrium.
.
Because the input level is lower, L unit 4
does not charge as quickly, which results in the delay in establishing
an equilibrium.
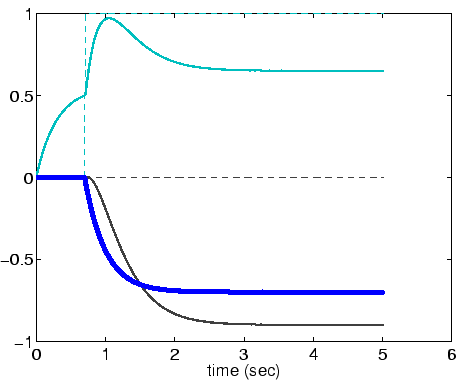
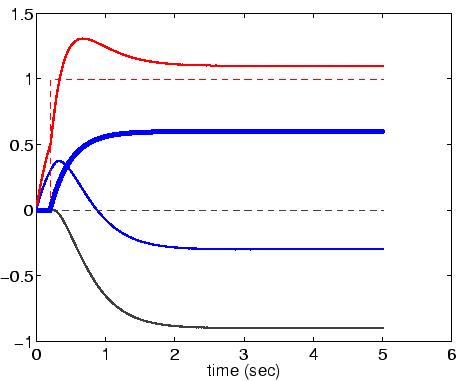
Assume a stimulus of 1 at position 8 and a stimulus of 0.6 at position 17.
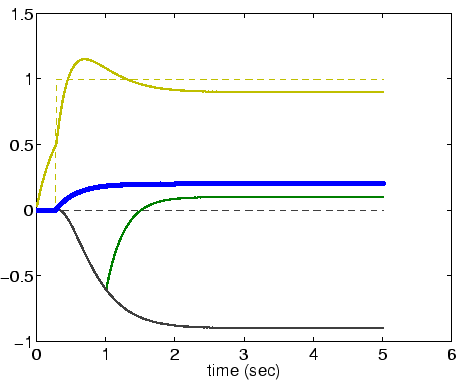
Question 1.4:
Where does the frog snap and
when?
Answer: The frog snaps in the direction
corresponding to M = -3, at about ![]() .
In the figure, the
thin, blue solid/dashed lines correspond to Lnet8 and L8; the
red line shows
Lnet17.
.
In the figure, the
thin, blue solid/dashed lines correspond to Lnet8 and L8; the
red line shows
Lnet17.
Assume that these stimuli are swapped.
Question 1.5:
where does the frog snap and when?
Answer: About ![]() .
At the position corresponding to M = 6.
.
At the position corresponding to M = 6.
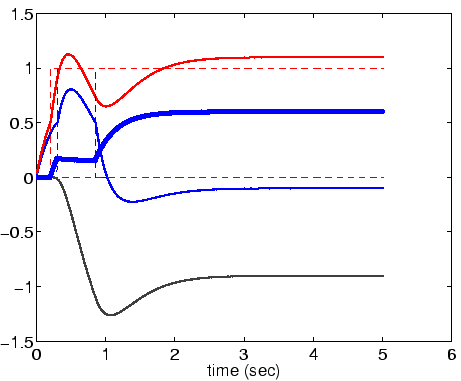
Suppose there is a stimulus of 1 at 17 and one of 0.8 at 8.
Question 1.6:
Where and when does the frog snap?
Answer: At about ![]() .
M = 6.
.
M = 6.
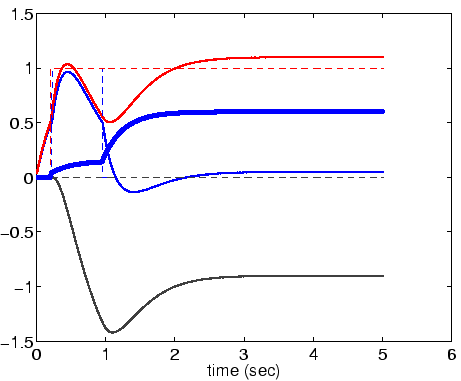
Suppose there is a stimulus of 1 at 17 and one of 0.95 at 8.
Question 1.7:
Where and when does the frog snap?
Answer: At about ![]() .
M = 6.
.
M = 6.
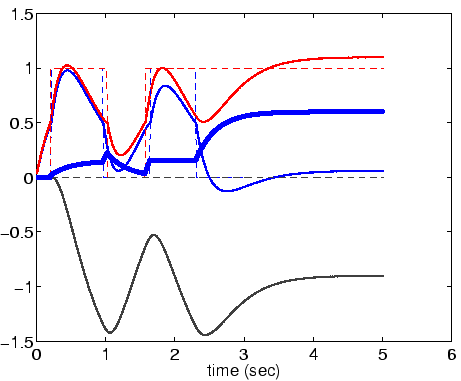
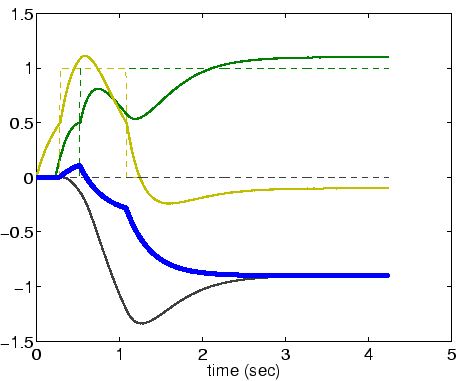
Suppose there is a stimulus of 1 at 17 and one of 0.96 at 8.
Question 1.8:
Where and when does the frog snap? Describe the time-course of the
relevant selection unit state variables.
Answer: At about ![]() ;
M = 6. Selection units 8 and 17 turn
on at almost the same time. This causes the inhibitory unit to
achieve a high level of activation, which in turn results in both
units turning off. Once the inhibitory signal has resided, these
units again return to an on state. Shortly thereafter, unit 8 turns
off again (reducing the input to the inhibitory unit). Before unit 17
has an opportunity to turn off, the activation of the inhibitory unit
drops to a level such that unit 17 can sustain its activation level.
;
M = 6. Selection units 8 and 17 turn
on at almost the same time. This causes the inhibitory unit to
achieve a high level of activation, which in turn results in both
units turning off. Once the inhibitory signal has resided, these
units again return to an on state. Shortly thereafter, unit 8 turns
off again (reducing the input to the inhibitory unit). Before unit 17
has an opportunity to turn off, the activation of the inhibitory unit
drops to a level such that unit 17 can sustain its activation level.
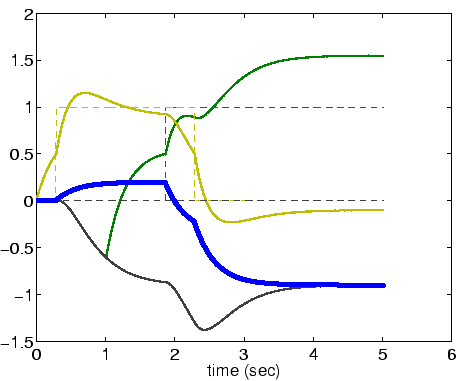
Suppose there is a stimulus of 1 at 17 and one of 0.999 at 8.
Question 1.9:
Where and when does the frog snap?
Answer: At about ![]() .
M = 1.3. This is known as the average fly.
.
M = 1.3. This is known as the average fly.
Suppose a fly of flyness level 0.8 appears at retinal position 13,
and then a second fly of level 1.0 appears ![]() later at
position 2.
later at
position 2.
Question 2.1:
When and where does the frog snap? Explain.
Answer: The frog still snaps at approximately ![]() at location
M = 2. Even though the second stimulus has a higher level of input,
it is not able to overcome the inhibition due to the first stimulus.
at location
M = 2. Even though the second stimulus has a higher level of input,
it is not able to overcome the inhibition due to the first stimulus.
Question 2.2:
What is the longest delay at which the second stimulus can be
presented such that it wins the competition? When does the frog snap?
Answer: About ![]() .
The frog snaps at about
.
The frog snaps at about ![]() .
.
Return to a presentation delay of ![]() .
.
Question 2.3:
How high would the second
stimulus have to be before it wins the competition? When does the
frog snap in this case?
Answer: About 1.45. The frog snaps at about ![]() .
.
As you have observed, there are stimulus conditions under which the frog circuit cannot make a snap decision before he is forced to snap - even though there are suitable stimuli at which to snap.
Question 3.1 (2 pts):
Suggest and implement a
simple, distributed mechanism that reduces the probability of our frog
choosing the average fly. Be convincing in your demonstration that
your fix works well; it does not have to work correctly every
time (just often enough for our frog not to starve).
One Answer: Add a slowly changing noise process to each selection
unit. In my implementation, each L unit receives an additional
random input. At every time step, with probability 0.03, the entire
vector of injected noise is changed. The random noise for each unit
is drawn from a uniform distribution in the range [-M .. M].
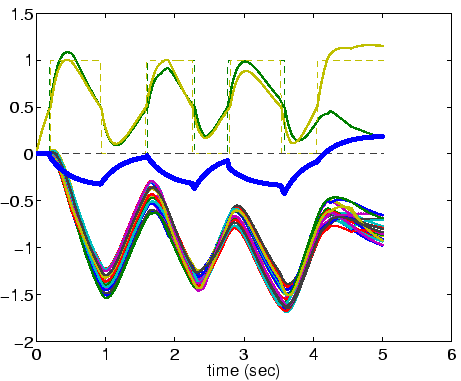
The following figure shows the time course of the relevant variables when M = 0.2. The green and yellow lines show Lnet* of the two competing units; and the motor output is shown by the heavy blue line.
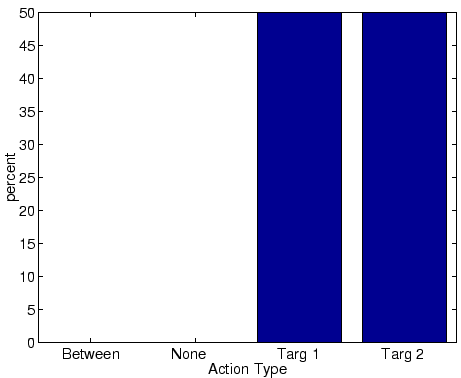
A histogram showing the outcome over 50 trials is shown in the following figure. In this case, one of the two targets is always chosen.
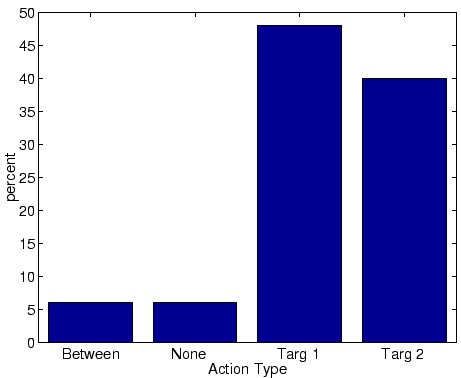
When M = 0.1, some trials end with either both targets selected (in which case, the average fly is snapped at) or neither target is selected (we assume that no snap occurs).
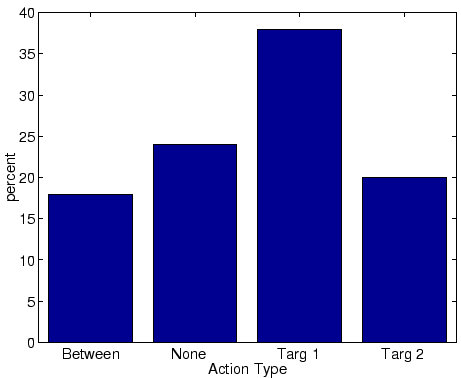
When M = 0.05, many trials end with the frog not snapping at a valid target.
This document was generated using the LaTeX2HTML translator Version 98.1p1 release (March 2nd, 1998)
Copyright © 1993, 1994, 1995, 1996, 1997, Nikos Drakos, Computer Based Learning Unit, University of Leeds.
The command line arguments were:
latex2html -no_navigation -split 0 -t CMPSCI/NSB 691C: HW2 -dir html -no_reuse -tmp /tmp hw2.tex.
The translation was initiated by Andrew H. Fagg on 2001-10-30