
See more about PI Chris Weaver and current and past students in his research group.
Summary
Visual exploration and analysis of data is increasingly important for advancement in virtually every area of human endeavor. Whether recorded directly by people or indirectly using machines, data captures our observations and interpretations of the world.
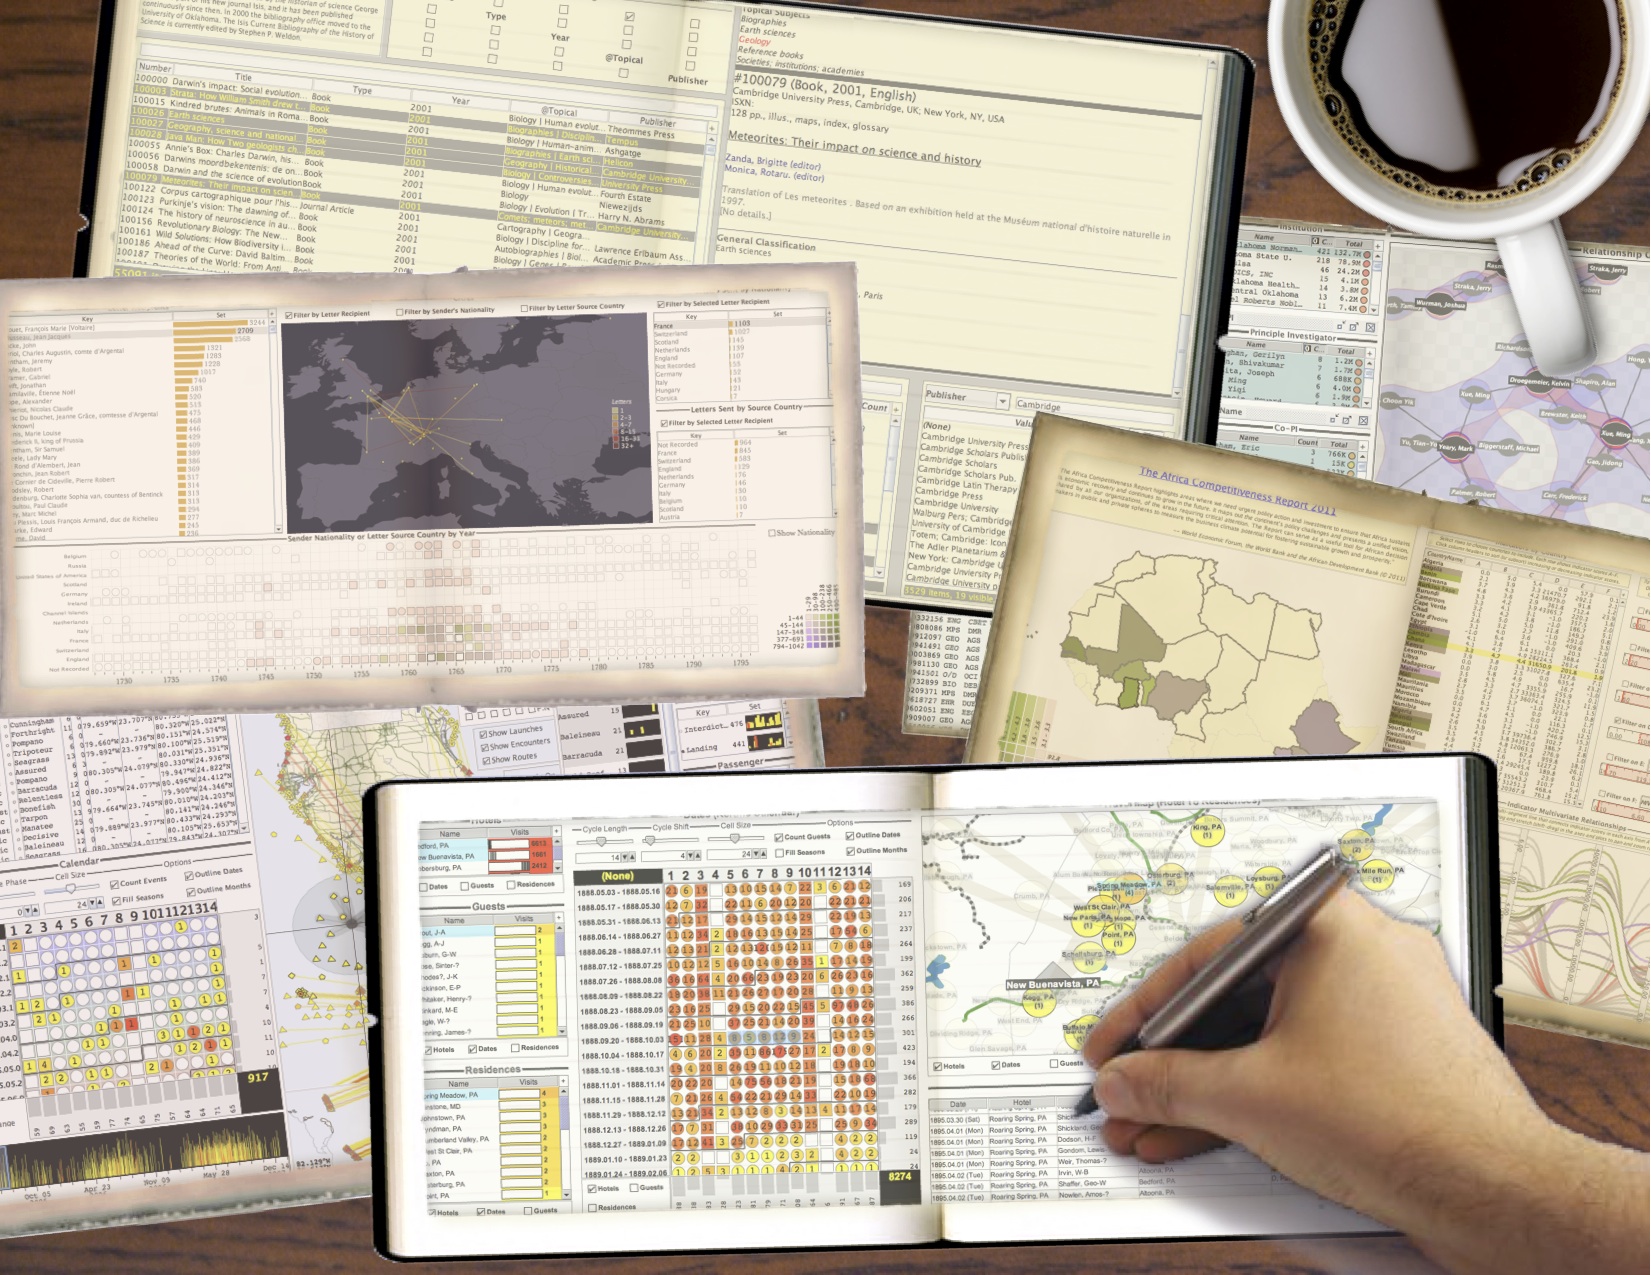
When people interact with data, it is almost always in a visual form like graphics or text. The goal of this project is to vastly expand the usefulness of interactive visualizations by providing a general way to create and edit data inside the visualizations themselves.
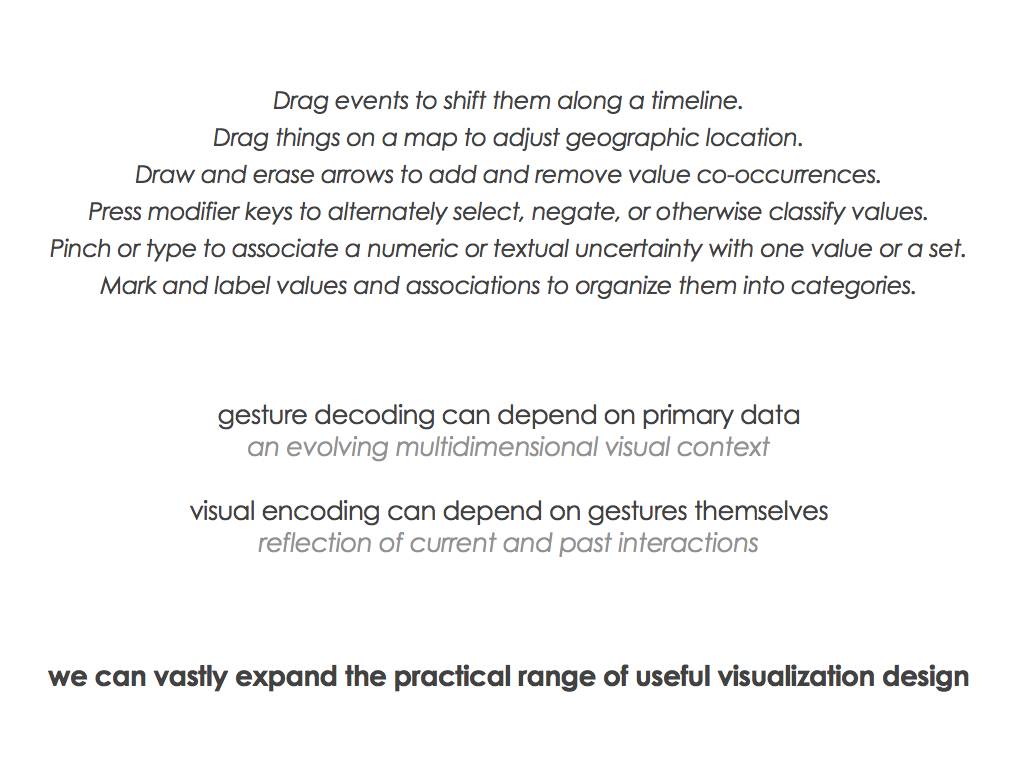
The key new idea of the project is that visualization users can perform sequences of gestures with common input devices to express their observations and interpretations directly in visual form. The visualizations not only show data, but also serve as meaningful graphical spaces in which to edit that data.
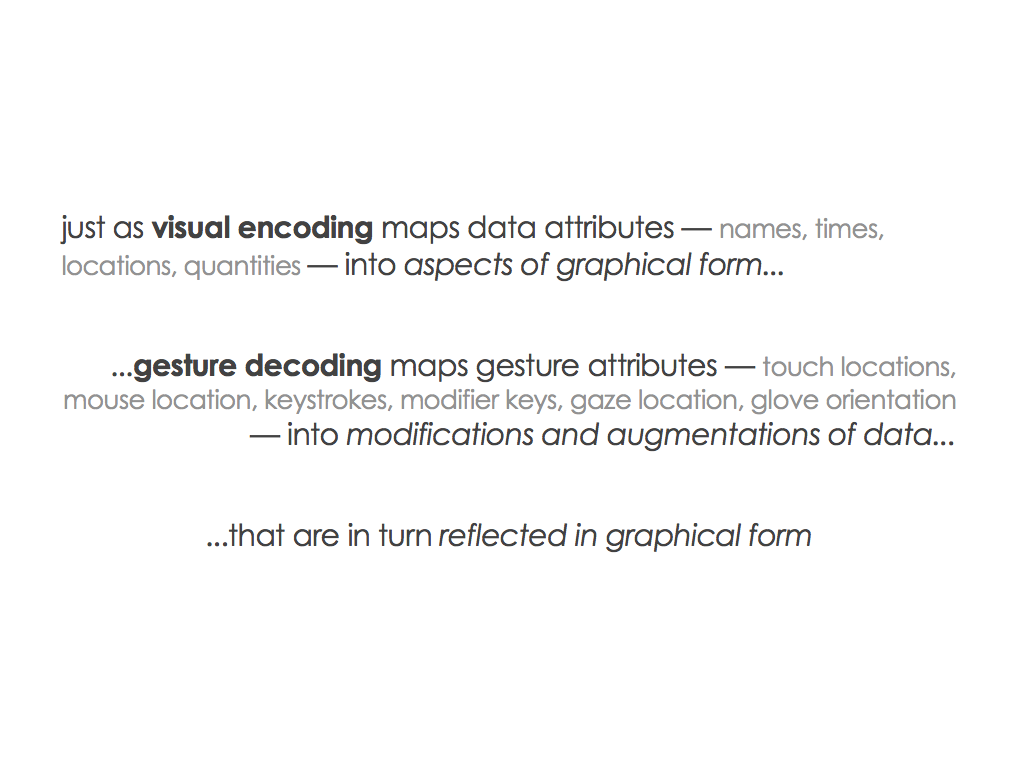
By extending the data processing workflows and display techniques that are currently used in popular visualization tools and software libraries, we can flexibly and expressively translate the details of interactions into precise data changes with simultaneous visual feedback.
The innovative contributions of the project will include a general method to support interactive data editing in visualizations, a diverse collection of data editing gestures, a set of patterns to guide the process of designing visualization tools with data editing features, a declarative programming language for quickly building those tools, and a variety of built tools that show off real applications of data editing in visualizations.
The project focuses on developing, evaluating, and distributing tools for scholarly research in the digital humanities. It tightly integrates education to bring together students and researchers from computer science, information science, and the humanities, and provide them with concrete opportunities to engage in authentic interdisciplinary collaboration.
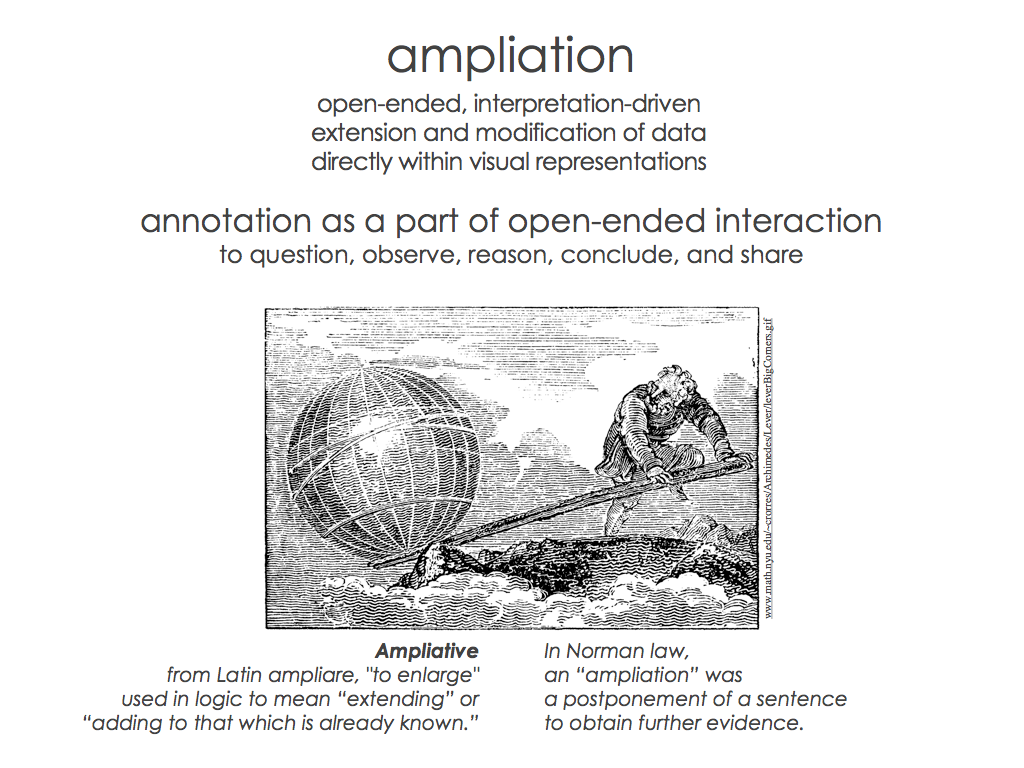
Scholarly research and education in the humanities involves open-ended exploration, analysis, and interpretation of complex data sets in diverse areas of study. This makes it an exemplary first target to demonstrate how gesture-based visual editing can be broadly applied to data analysis in virtually every segment of society. The broader impacts of the project will spring from the availability of a new, foundational, general-purpose methodology to support data entry, organization, annotation, and correction.
Project products will include publications, tutorials, videos, the visualization gesture system as open source software, a compendium of data editing gestures, and a gallery of demonstration visualization tools for public download. Ongoing information about the project and links to the resulting resources will appear on this page as they develop.
Research Efforts and Contributions(Last updated October 23, 2020)
Interaction Survey (2014–2015)
Designing Gestures for Data Editing (2015–2017)
Geometric Data Editing (2015–2017)
Exploring Geometries for Editing (2016–2018)
Gesture Browser (2017–2018)
Gesture Architecture (2017–2019)
Gesture Gallery (2019–2020)
Coordination for D3 (2019–2020)
Gestures for Navigation and Selection on Spheres (2020–present)
Improvise with JavaFX (2020–present)
Improvise with Gestures (2020–present)
Student Opportunities
This project involves collaboration with digital humanities scholars and educators from OU History of Science, OU Library & Information Science, and the Stanford Humanities Center. Work on the project includes data collection, software implementation, visualization development, technical support for project-related research activities of our collaborators, as well as to provide assistance in visualization design, usability evaluation, educational outreach, and technical support for project-related education activities of our collaborators.
I am happy to chat with students (graduate or undergraduate) interested in participating on the project somehow. Students from our Data Science & Analytics program are also welcome. Inquiries from graduate students with relevant experience outside of CS are also welcome, including students in the humanities interested in exploring the digital side!
I often advise graduate and undergraduate students in the areas of information visualization, visual analytics, databases, human-computer interaction, and the digital humanities. There are many possibilities for Master's theses, independent study, and undergraduate honors research within the scope of this project.
OU students in ANY field interested in participating in this project in a less formal way, such as beta testing of the software as it develops, are welcome to contact me. Although the project itself targets humanities learning and research, the software and other products of the project are general-purpose.
Press
2014.08.27 - The Oklahoma Daily (OU student newspaper; article):
“Data manipulation may soon be easy”
“Data manipulation may soon be easy”
2014.08.12 - The Norman Transcript (press release):
“OU professor awarded National Science Foundation CAREER grant”
“OU professor awarded National Science Foundation CAREER grant”
2014.08.12 - OU Public Affairs (press release):
“OU Professor Awarded National Science Foundation CAREER Grant to Create Visualization Tools for the Digital Humanities”
“OU Professor Awarded National Science Foundation CAREER Grant to Create Visualization Tools for the Digital Humanities”
Supported Publications and Presentations